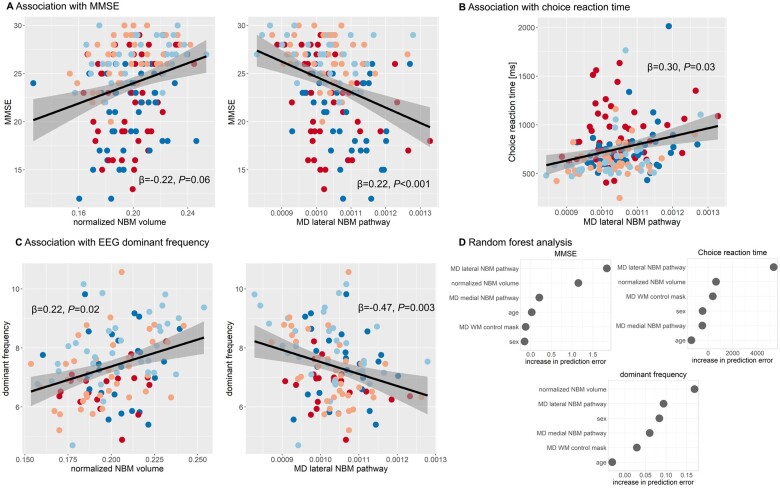
Figure 4.
Association with cognitive and attentional performance. Association between mean diffusivity (MD) along NBM pathways and (A) MMSE as a measure of overall cognition, (B) choice reaction time and (C) EEG dominant frequency. β-values result from a multiple linear regression analysis including mean diffusivity along the two NBM pathways, normalized NBM volume, diagnosis, age, sex and mean diffusivity from the white matter control mask as predictors. Grey shaded areas correspond to 95% confidence intervals. (D) Results from the random forest analysis showing the conditional feature importance (i.e. increase in prediction error when permuting a feature on a grid defined by the other features in the model). Higher values indicate higher importance of a feature in predicting the response variable (choice reaction time, MMSE and EEG dominant frequency). AD = Alzheimer’s disease dementia; MD = mean diffusivity; WM = white matter.

