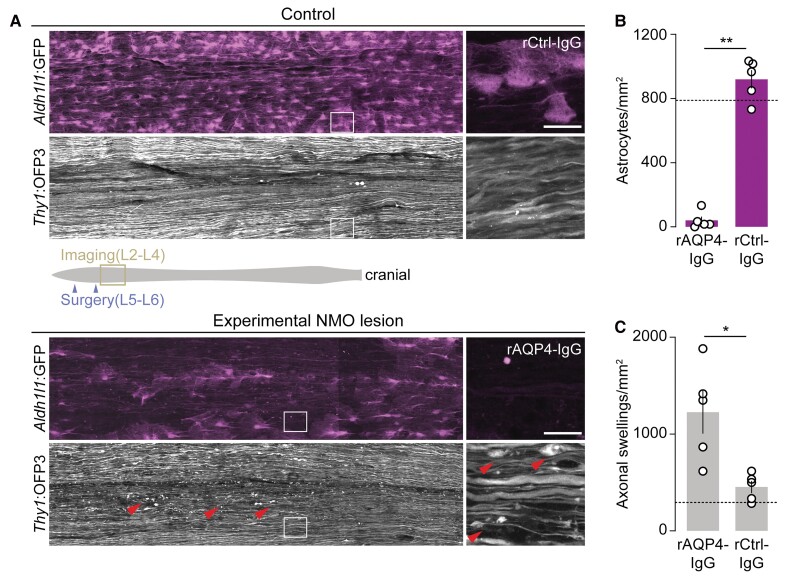
Figure 2.
Astrocyte depletion leads to persistent axonal beading in experimental NMO lesions. (A) Representative overview confocal images of spinal cord whole mounts of Aldh1l1:GFP × Thy1:OFP3 mice. In control tissue (top), astrocytes (Aldh1l1:GFP, magenta) remained mostly unaffected 24 h after superfusion with rCtrl-IgG/complement (90 min) with only a small number of axons showing swellings (Thy1:OFP3, grey), possibly due to surgery. In experimental NMO lesions 24 h after superfusion with rAQP4-IgG/complement (for 90 min; bottom), astrocyte loss and axonal beadings (arrowheads) were apparent. Note patchy astrocyte loss probably due to the non-homogenous distribution of rAQP4-IgG/complement in subdural space; only substantially astrocyte-depleted areas were included in analysis. (B) Astrocyte density within analysed areas of chronic lesions and control-treated spinal tissue (rCtrl-IgG: 920 ± 57 versus rAQP4-IgG: 40 ± 24 mm−2, n = 5 mice each). (C) Density of beaded axons in experimental NMO lesions versus control-treated spinal tissue (rCtrl-IgG: 453 ± 63 versus rAQP4-IgG: 1227 ± 222 mm−2, n = 5 mice each). Only astrocyte-depleted regions were included in the analysis for the rAQP4-IgG group. Dashed lines indicate the average density of astrocytes (B) and swollen axons (C) quantified in mice without any surgical interventions (n = 3 mice). Schematic representation of spinal cord (grey) with surgery (purple arrowheads) and imaging (yellow box) areas is shown in A. Boxed areas are magnified on the right. n ≥ 48 axons were analysed per animal. Data are represented as mean ± SEM. Mann–Whitney test; **P = 0.0079 in B; *P = 0.0159 in C. Scale bars = 40 µm.

