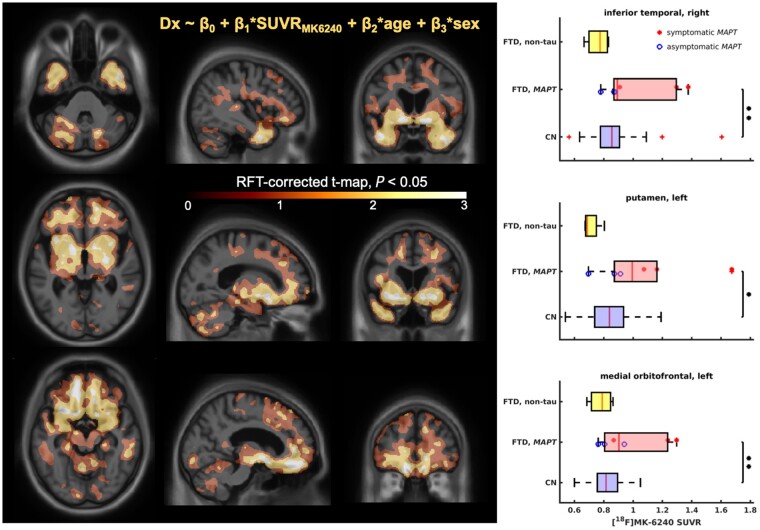
Figure 4.
FTD versus cognitively normal model. Results of the general linear model. Left: RFT-corrected maps showing voxels with the greatest difference between FTD and cognitively normal (CN), focusing on the slices showing salient voxels for inferior temporal cortex (top), basal ganglia (middle) and medial orbitofrontal cortex (bottom). Right: Comparisons of SUVR distributions for the salient regions of interest (ROI) including right inferior temporal cortex (top), left putamen (middle) and left medial orbitofrontal cortex (bottom). The significance is shown as: *P < 0.05, **P < 0.01 (two-sample t-test).

