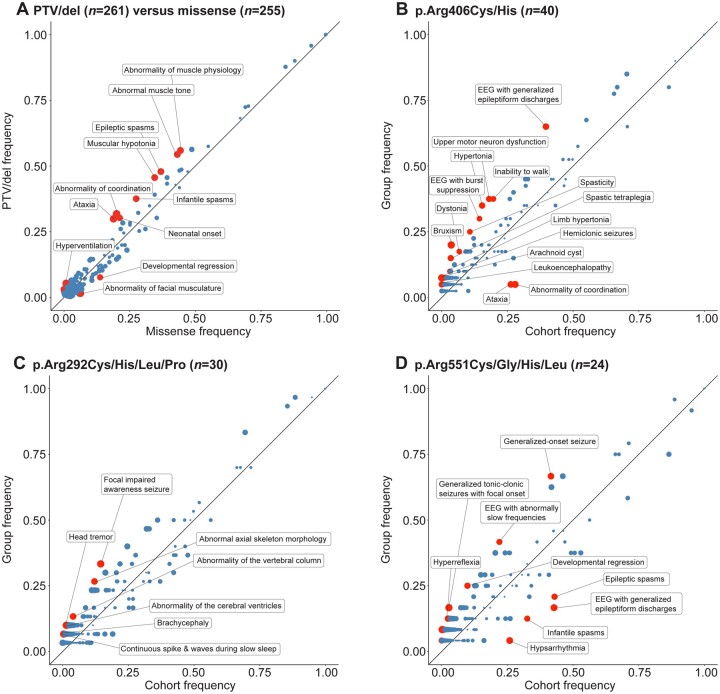
Figure 4.
Phenograms of missense variants versus PTV and most frequent recurrent variant hotspots. (A) Phenogram comparing the frequency of phenotypic features in individuals with PTV/del (n = 261) and individuals with missense variants (n = 255). PTV/dels included splice sites, frameshifts and whole and partial gene deletions. (B) Phenogram comparing the frequency of phenotypic features in individuals with variants in p.Arg406Cys/His and the remainder of the cohort. (C) Phenogram comparing the frequency of phenotypic features in individuals with variants in p.Arg292Cys/His/Leu/Pro and the remainder of the cohort. (D) Phenogram comparing the frequency of phenotypic features in individuals with variants in p.Arg551Cys/Gly/His/Leu and the remainder of the cohort. Red points indicate HPO terms with uncorrected P-values < 0.05, while blue points indicate HPO terms with uncorrected P-values ≥ 0.05. Size of points indicate −log10(P-value).

