Fig. 1.
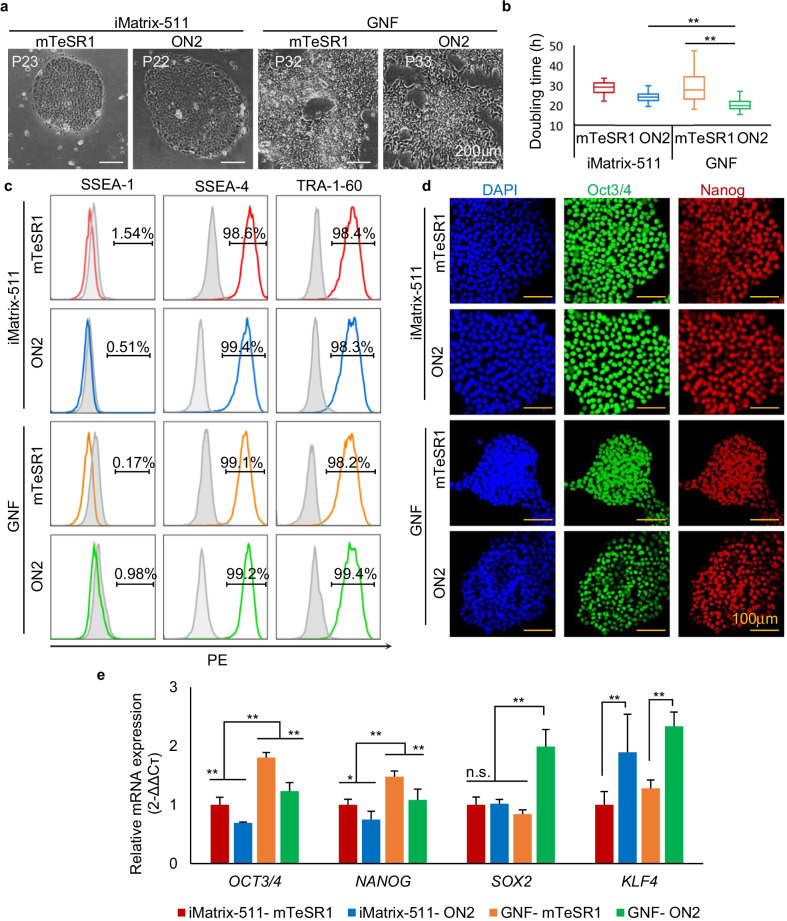
hiPSCs pluripotency after long-term expansion in ON2 medium on iMatrix-511 or GNF. a 253G1 hiPSC clone morphology on iMatrix-511 and GNF substrates over 20 passages with ON2. mTeSR1 was used as the positive control medium. GNF: gelatin nanofibrous. Scale bar, 200 µm. b Comparison of doubling times between 253G1 hiPSCs grown on iMatrix-511 and GNF, respectively (passage number = 20–33, **p < 0.01, data are mean ± SD). c Flow cytometric analysis of SSEA4, TRA-1-60, and SSEA1. Light-gray solid histograms show the isotype control populations, and color hollow histograms show the stained populations, respectively. The percentages of marker-positive cells are presented in each graph. Cell events were normalized to the mode. d Immunofluorescence images of hiPSC colonies stained for pluripotent markers Oct3/4 (green) and Nanog (red). Nuclei were stained with DAPI dye (blue). Scale bar, 100 µm. qRT-PCR was carried out to compare the expression levels of pluripotency genes OCT4, NANOG, SOX2, and KLF4 in 253G1 hiPSCs cultured on iMatrix-511 and GNF with ON2 or mTeSR1. (n = 6 biological independent samples; Data are mean ± SD, *p < 0.05, **p < 0.01)

