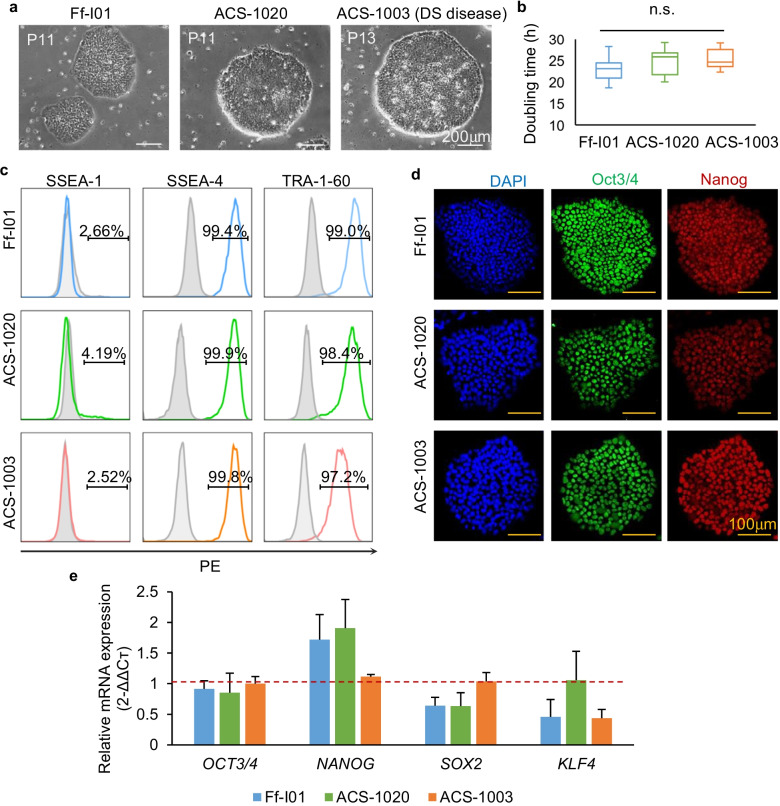
Fig. 4.
ON2 medium sustains the prolonged expansion of different hiPSC lines. a Ff-l01, ACS-1020, and ACS-1003 hiPSC clones after long-term expansion of iMatrix-511 in the ON2 medium. Scale bar, 200 µm. b Comparison of doubling times for Ff-l01, ACS-1020, and ACS-1003 hiPSCs cultured in ON2 (passage number = 12–15, n.s. no significant difference; data are mean ± SD) (Ff-l01: 23.09 ± 2.88; ACS-1020: 24.78 ± 3.02; ACS-1003: 25.28 ± 2.21. c FACS analysis of pluripotent marker-positive cells. Light-gray solid histograms show the isotype control populations, and color hollow histograms show the stained populations, respectively. The percentages of maker-positive cells are presented in each graph. Cell events were normalized to mode. d Immunofluorescence staining of pluripotency markers in hiPSCs. Green: Oct3/4; red: Nanog; blue: DAPI. Scale bar, 100 µm. e qRT-PCR analysis of pluripotent gene expression levels of OCT4, NANOG, SOX2, and KLF4 in three hiPSCs sustained in ON2. Fold expression was compared to that in 253G1 hiPSC cell lines in ON2. (n = 3 biological independent sample, n.s. no significant difference; data are mean ± SD)

