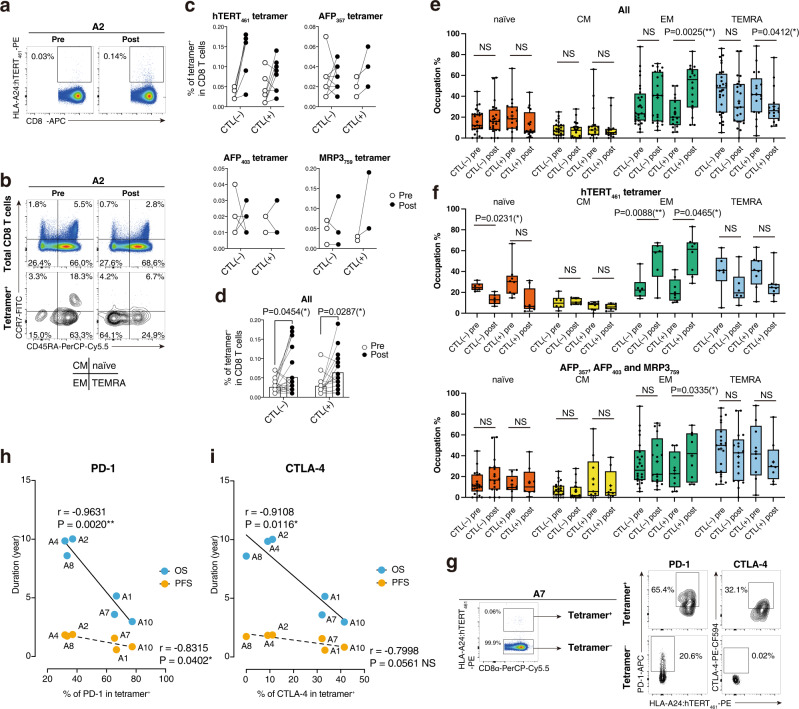
Fig. 2. Induction of HLA-A24:peptide tetramer-binding T cells and phenotypic features.
A representative example of flow plots is shown. The frequency of the CD8α+tetramer+ fraction was calculated (a). Both total CD8+ T cells and tetramer+CD8+ T cells were detected by CD45RA and CCR7. Four fractions of naïve, central memory (CM), effector memory (EM), and terminally differentiated effector memory with CD45RA (TEMRA) are shown (b). Tetramer positivity among CD8+ T cells was compared between pre and postvaccination in CTL( − ) and CTL( + ) of each vaccine study. Samples from the same donors are connected by solid lines. c. The results were combined in one graph. Samples from the same donors and tetramers are connected by solid lines. Mean values are shown by open bars. Two-way repeated-measures ANOVA followed by Bonferroni and Sidak’s multiple comparison post hoc test was carried out. *P < 0.05. d Frequencies of naïve, CM, EM, and TEMRA fractions among tetramer+CD8+ T cells are displayed in box-and-whisker plots. CTL( − ) (n = 26) and CTL( + ) (n = 16) of pre and post are shown. Statistical analysis was conducted using two-way ANOVA followed by Bonferroni and Sidak’s multiple comparison test to assess differences in composition among the different conditions of CTL induction and treatments. *P < 0.05; **P < 0.005; NS, not significant; error bar, maximum to minimum; horizontal lines of box, first quartile to third quartile; +, mean value (e). The frequencies of naïve, CM, EM, and TEMRA fractions among tetramer+CD8+ T cells of the hTERT study (n = 14) and the other three cohorts (n = 28) were analyzed separately. Two-way ANOVA followed by Bonferroni and Sidak’s multiple comparison test was carried out. *P < 0.05; **P < 0.005; NS, not significant; whiskers, maximum to minimum; horizontal lines of box, first quartile to third quartile; +, mean value (f). Expression of inhibitory receptors PD-1 and CTLA-4 by HLA-A24:hTERT461 tetramer-binding CD8+ T cells was assessed. g The percentages of PD-1/CTLA-4 expression and overall survival (OS) period/progression-free survival (PFS) were plotted, then liner regression lines were calculated. r, Pearson’s r; *P < 0.05; **P < 0.005; NS, not significant (h, i) Source data are provided as a Source Data file.

