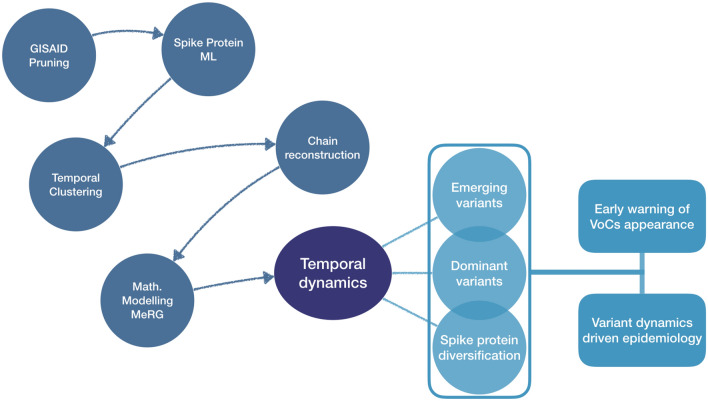
Figure 1.
Methodology and main outcomes. Schematic representation of the work-flow we follow in this work. The figure is read from left to right, with the blue circles summarising the main steps of our investigation, with leads to a reconstruction of the temporal dynamics of the diffusion of the variants (dark blue oval). The arrows show their logical sequence. Intermediate results are assembled in the vertical box. In the light blue boxes on the right, we summarise the two main applications of the results: the early warning tool for the appearance of relevant variants and the reconstruction of the variant epidemiological dynamics.

