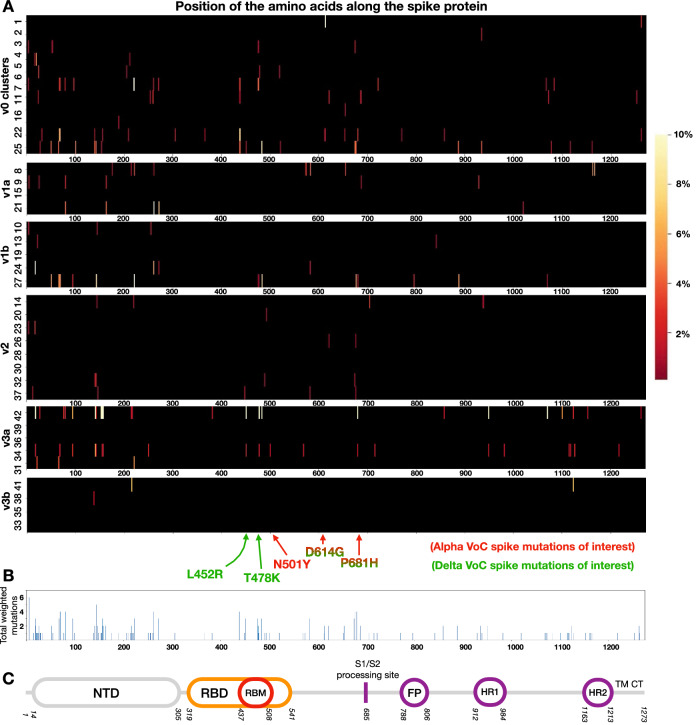
Figure 5.
Patterns of spike protein diversification of the emerging variants. Heatmaps indicate for each cluster in a chain (A) the location and number of amino acid substitutions counted per all variants in a cluster when compared to the previous cluster and normalised accordingly (see Supplementary material). Subdominant variants in each cluster are retained if their frequency is above 1% in the cluster. (B) recapitulates the sum of all the values from all chains in A, while (C) shows the S protein structure for reference.

