
Fig. 4. The junction crossovers contain unique ion binding positions.
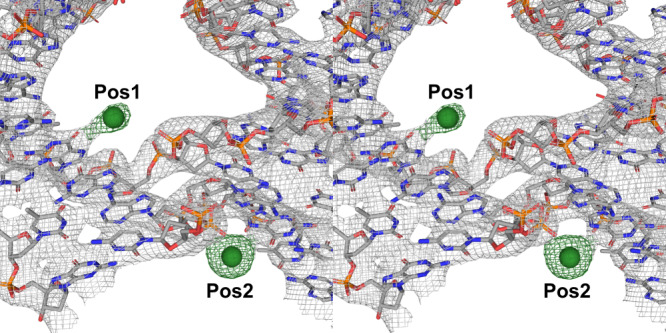
Stereoscopic view, using J21 in the 4 × 5 system, 2Fo–Fc electron density accounting for the bases at the crossover regions are contoured at σ = 2.0, and the individual ion positions 1 and 2 (indicated Pos1 and Pos2) are independently contoured in the corresponding electron density at σ = 4.0. The presence of arsenic at these sites was substantiated by transferring the crystals into TAE-Mg2+ (40 mM Tris, 20 mM acetate, and 1 mM EDTA pH = 8.6), and subsequently freezing the crystals. The crystals were scanned at the arsenic K edge (λ = 1.04 Å) where the corresponding arsenate peak was present. No other components within the crystallization buffers could account for the resulting peaks in the Fo–Fc difference maps for the ions at their corresponding sites. Atoms are indicated using the following: carbon (gray), nitrogen (blue), oxygen (red), phosphate (orange), and arsenic ions (green spheres).