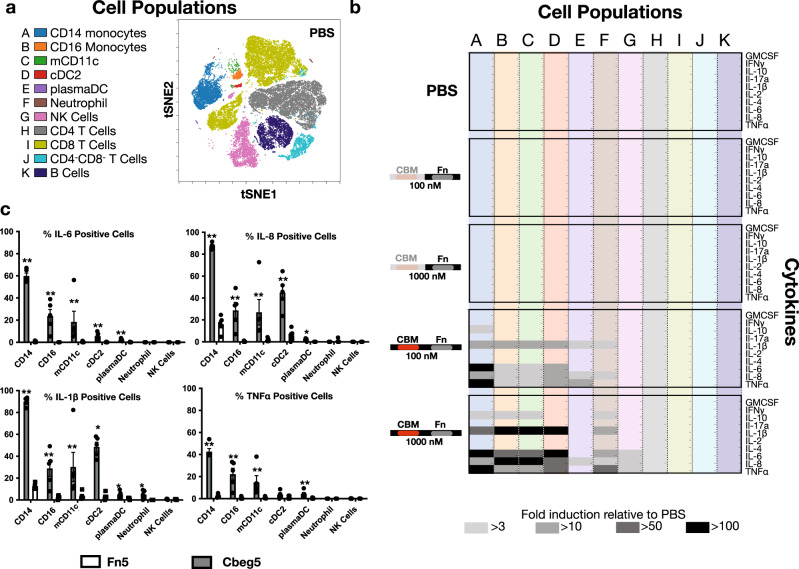
Fig. 2. PBMC response to Cbeg5.
Fresh PBMC were isolated from healthy patients and exposed to Cbeg5, Fn5 and PBS for 6 h and analyzed by CyTOF with a panel of 16 cell surface and 10 cytokine markers. a Cell surface markers distinguish major immune cell populations (A–K) that correlate to groups identified by tSNE analysis (Supplementary Fig. 2). b Fold induction of 10 cytokines across cell populations A–K from (a). Fold induction is calculated relative to PBS control. Cytokine responses > 3-fold to > 100-fold are marked with gray-shaded boxes. Proteins assayed at 100 nM or 1000 nM as indicated. (Data is a single experiment. PBS data is normalized to a replicate experiment with PBS). c Bar graph (mean ± s.e.m) of percent positive cells for each cytokine in specific cell populations in response to Cbeg5 or FN3 control at 500 nM concentration (N = 5 from three independent experiments, unpaired, two-sided Mann–Whitney test comparing Cbeg5 to Fn3 control in each cell population) ***p < 0.001 **p < 0.01 *p < 0.05.

