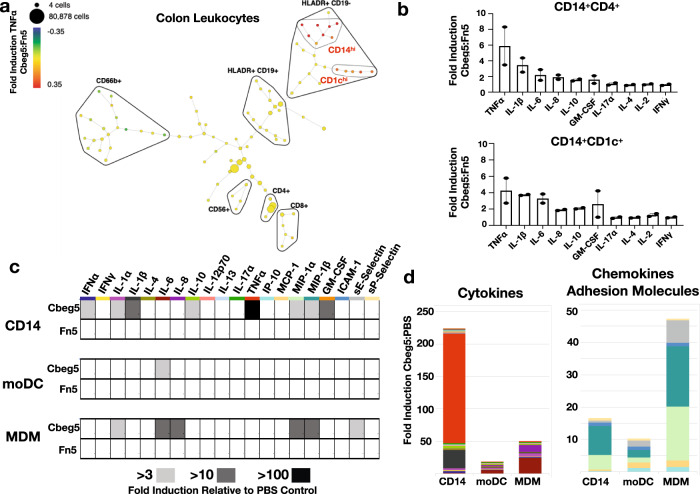
Fig. 3. Intestinal leukocyte response to Cbeg5.
Fresh colon tissue was obtained from patients at the time of surgery for isolation of lamina propria leukocytes (LPL). a LPL cells were exposed to Cbeg5 or Fn5, analyzed by CyTOF and the data evaluated by SPADE. A SPADE plot for Cbeg5 induced TNF-α production from intestinal leukocytes. Fold induction calculated relative to Fn5. Cbeg5 induces cytokine production in two myeloid cell clusters (CD19−CD56−CD66b−HLADR+) that are CD14hi or CD1chi. Clusters are annotated by manual gating of indicated cell surface markers. b Cells from the CD14 cluster and CD1c cluster were analyzed to identify CD14+CD4+ cells (monocyte derived macrophage markers) and CD14+CD1c+ cells (monocyte derived dendritic cell markers). Bar graphs depict Cbeg5 induced cytokine production in CD14+CD4+ and CD14+CD1c+ cells (mean ± s.e.m, N = 2, two independent experiments). c Isolated blood CD14+ monocytes were differentiated in vitro into macrophages (MDM) and dendritic cells (moDC) and exposed to 500 nM concentrations of Cbeg5, Fn5 and PBS. Cytokines, chemokines, growth factors and adhesion molecules were analyzed by Luminex (Procarta PlexTM). Heatmap of cytokine production with > 3-fold to > 100-fold induction shown with gray shaded boxes (induction relative to PBS control, data is mean of triplicate experiments for CD14+ monocytes and duplicate experiments for mMAC, mDC). d Bar graph of cytokine or chemokine and adhesion molecule production for cell populations in response to Cbeg5. Bar graph colors are derived from labels used in the heatmap (c).

