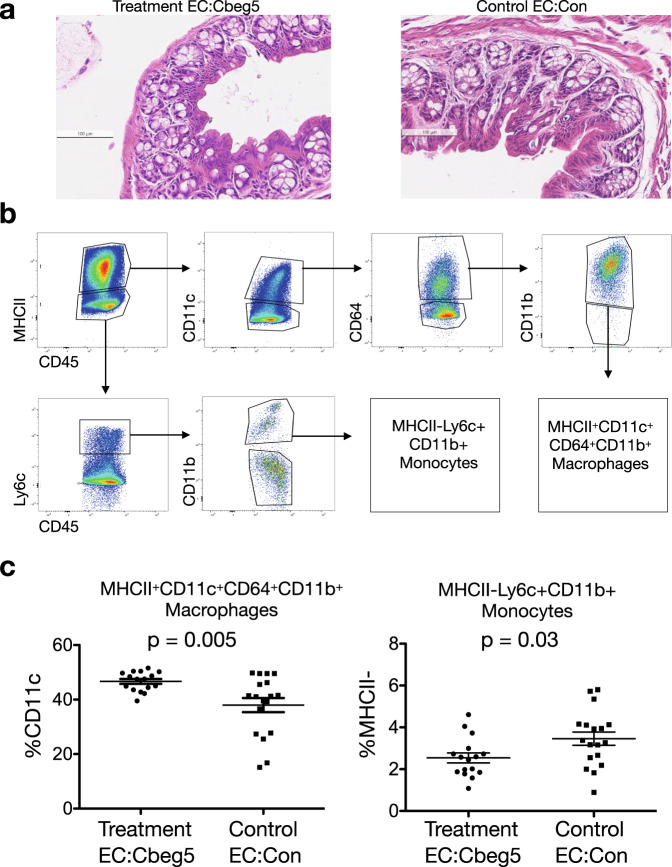
Fig. 4. Immune response to Cbeg5 expression in vivo.
Wild-type 8-week C57BL/6 mice were colonized with E. coli engineered to express Cbeg5 (Treatment, EC:Cbeg5) or E. coli with an empty vector (Control, EC:Con). After 1 week of colonization the colon was analyzed for inflammatory changes by histology (a) and for change in immune cell populations by flow cytometry (b, c). a No difference was observed in colon histologic inflammatory indices (one representative image, Supplementary Fig. 5). b After gating for singlets and live cells (Aqua LIVE/DEAD) the gating schema is shown for identification of macrophages MHCII+CD11c+CD64+CD11b+ and monocytes MHCII-Lyc+CD11b+. c There was a significant increase in lamina propria MHCII+CD11c+CD64+CD11b+ macrophages and a decrease in MHCII−Lyc+CD11b+ monocytes in the treatment group (N = 16 (8 M/8 F) Treatment, N = 18 (9 M/9 F) Control. Data represents 4 independent experiments. Error bars are mean ± s.e.m. Control and treatment populations compared using an unpaired, two-sided Mann–Whitney test).

