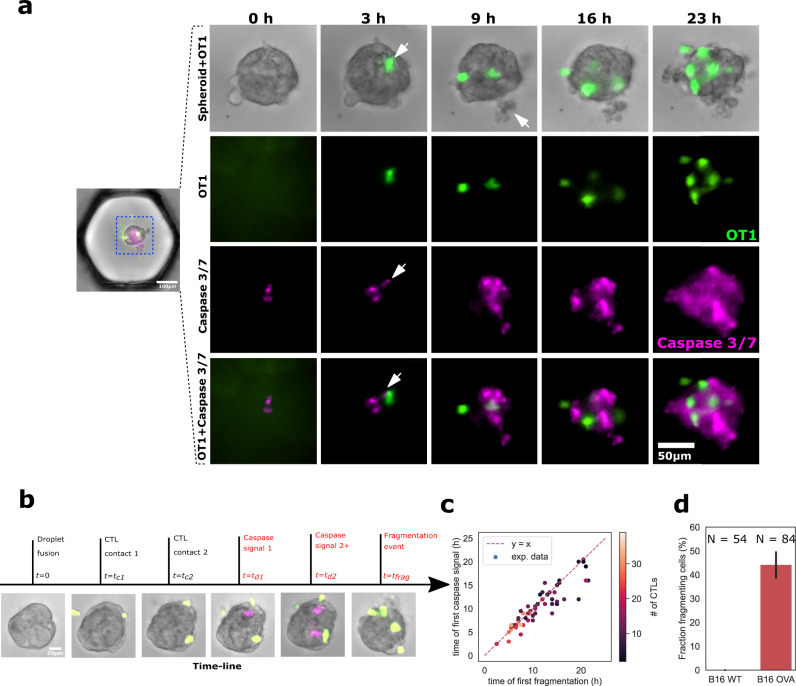
Fig. 4. CTLs kill tumor cells within spheroids.
a Representative sequence showing CTL (OT1) positions on the spheroid, caspase 3/7 fluorescent death marker, and B16 cell fragmentation. The white arrow at 3h indicates the appearance of capsase signal next to a CTL. At 9 h it represents a fragmented dead cell. b Representative chronology showing the key events for a given spheroid interaction with CTLs: Contact times of CTLs on spheroids, detection of caspase 3/7 signal, detection of fragmentation events. c Time of first caspase signal vs. first observation of cell fragmentation. d Percentage of WT (black) and OVA (red) spheroids that show at least one fragmentation event in under 14 h. N equals 54 and 84 spheroids, respectively. The error bar is the SEM. Source data are provided as a Source data file.

