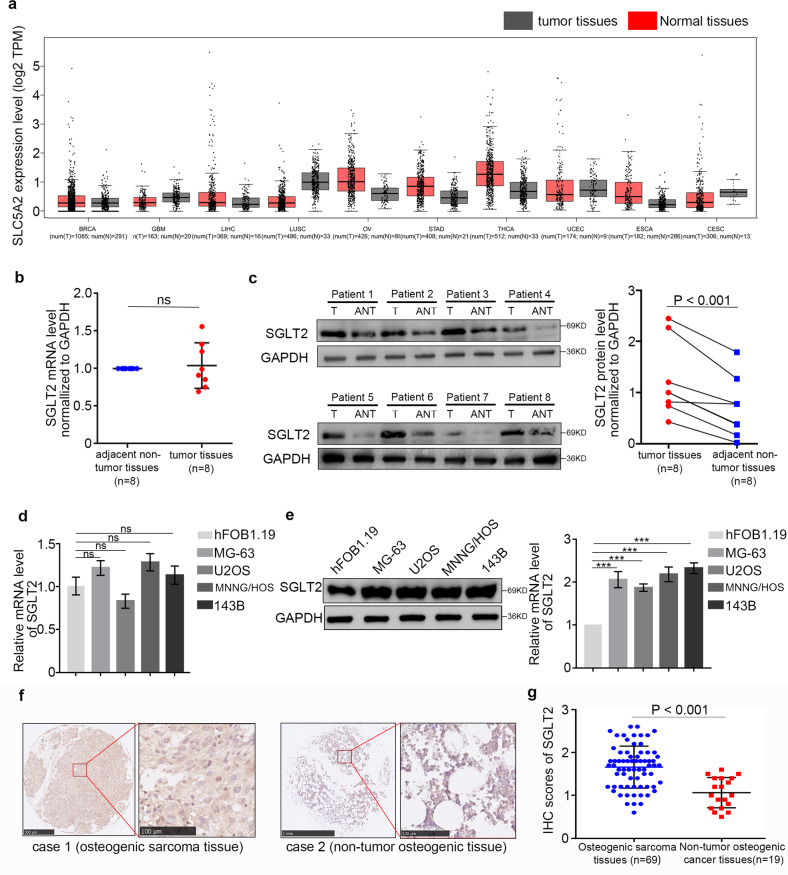
Fig. 1. SGLT2 overexpression at the protein level in osteosarcoma.
a Determination of the SGLT2 mRNA expression level by the GEPIA web tool. Boxplot analysis of the expression level showing log2 (TPM + 1) on a log-scale. RT-PCR analysis (b) and Western blot analysis (c) of the mRNA and protein expression of SGLT2 in eight paired osteosarcoma tumor tissues (T) and the matched adjacent normal tissues (ANT) of the same patient. GAPDH served as an internal reference. d RT-PCR analysis of the mRNA expression of SGLT2 in a normal osteogenic cell line (hFOB1.19 cell line) and four osteosarcoma cell lines (MG-63, U2OS, MNNG/HOS, and 143B cell lines). GAPDH served as an internal reference. e Western blot analysis of the protein expression of SGLT2 in a normal osteogenic cell line (hFOB1.19 cell line) and four osteosarcoma cell lines (MG-63, U2OS, MNNG/HOS, and 143B cell lines). Histogram to show the relative protein level of SGLT2 (n = 3). GAPDH served as an internal reference. f IHC images of SGLT2-stained Tissue Microarrays (TMAs). Scale bars are shown in the figure. g Dot plots of the IHC score of SGLT2 expression of TMA tissue sections (normal osteogenic specimens: n = 19, osteosarcoma specimens: n = 69, p < 0.001). Statistical analyses were performed using the D’Agostino and Pearson omnibus normality test.

