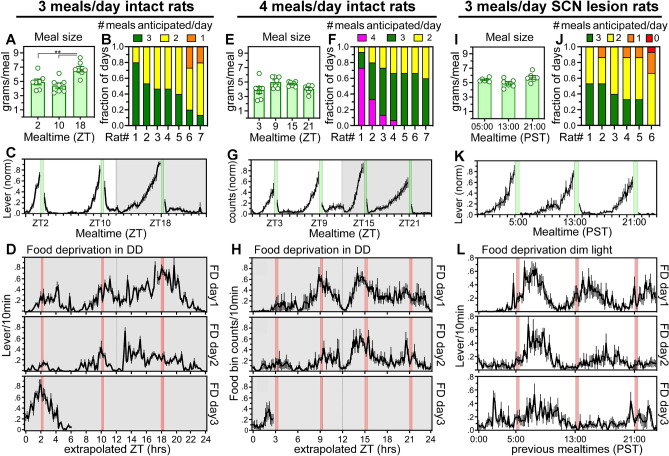
Figure 2.
Group mean food intake and food anticipatory activity in rats provided 3 or 4 daily meals. (A–D) Intact rats on 3-meal schedule. (E–H) Intact rats on 4-meal schedule. (I–L) SCN-ablated rats on 3-meal schedule. (A, E, I) Group mean (± SEM) grams food consumed at each mealtime. Significant differences between mealtimes, *p < .001. (B, F, J) Fraction of food restriction days that each rat anticipated 1, 2, 3 or 4 meals (number of daily meals anticipated color coded; red = 0, orange = 1, yellow = 2, green = 3, fuscia = 4). (C, K) Group mean (± SEM) activity waveforms of lever counts/10 min during the last week of restricted feeding. Mealtimes are denoted by vertical green bars. Operant responses during mealtime were excluded before data normalization and averaging across rats. (G) Group mean (± SEM) activity waveforms of operant nose pokes/10 min during the last week of restricted feeding. (D, H, L) Group mean (± SEM) activity waveforms during the food deprivation days in constant dark (D, H) or constant dim light. (L) Food deprivation days 1–3 are aligned vertically. Expected mealtimes denoted by vertical red bars.

