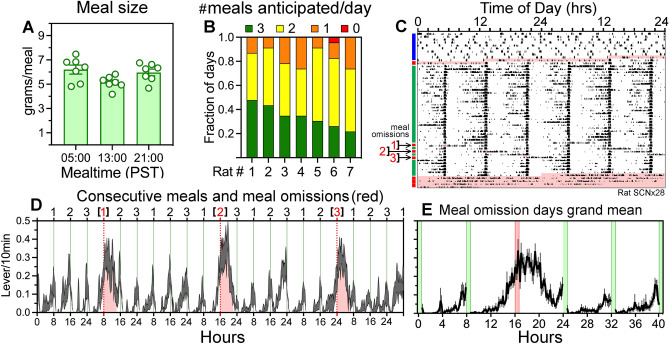
Figure 3.
Meal omission tests reveal robust timing of 3 daily meals (A) Food intake (grams) at each mealtime (group mean ± SEM). (B) Fraction of food restriction days that each rat anticipated 1, 2, or 3 meals (number of meals color coded; red = 0, orange = 1, yellow = 2, green = 3). (C) Double-plotted actogram of lever pressing in a representative rat with a SCN lesion estimated to be 95% complete (for histology, see supplementary Fig. S9b). Food was available ad-libitum for 10 days and then restricted to 3 daily mealtimes for 40 days. On days 29, 31 and 33 (denoted by arrows on the left of the actogram) lever pressing was not reinforced during one of the scheduled mealtimes. Pink shading denotes full days of food deprivation. (D) Group mean waveform of lever pressing during the week of single meal omission tests. Thin vertical lines indicate scheduled mealtimes. Pink shading denotes unreinforced lever pressing associated with each of the three meal omissions. (E) Grand mean (± SEM) of lever pressing during all meal omission test days, generated by aligning and averaging the meal omission days for each rat, and then for the group. Green vertical bars denote mealtimes, and the red vertical bar denotes the omitted meal.

