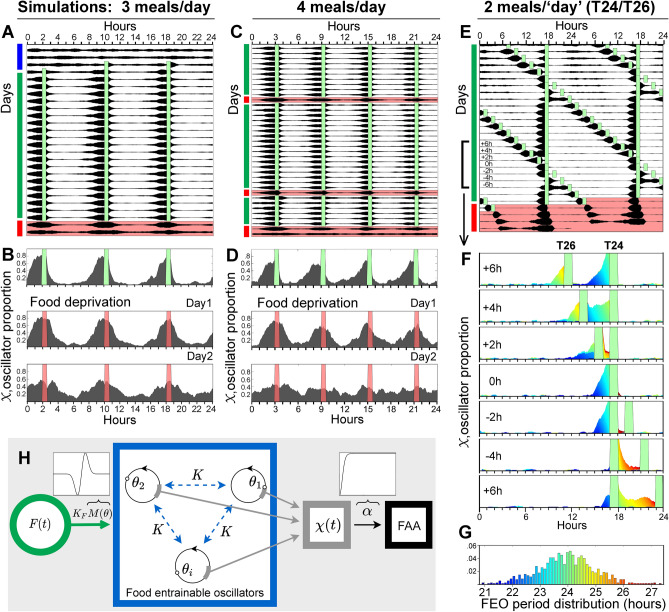
Figure 5.
A Kuramoto model simulates food anticipatory activity rhythms. Actograms and running waveforms showing predicted activity of multiple FEOs in response to 3 daily meals (A, B) 4 daily meals (C, D), and 2 daily meals provided at different periodicities (24 h and 26 h, E). Plotting format as in Fig. 1a. Green bars denote mealtimes. Red bars and pink shading denote expected mealtimes during a 2 or 3-day food deprivation test. (F) Waveforms illustrating the phase FEO oscillators colored by intrinsic periods during concurrent T24 and T26 meal schedules. Oscillators with periods > 24 h entrain to the 26 h meal and oscillators with periods < 24 h to the 24 h meal. (G) Frequency distribution and color-coding of FEO periodicities within the 21–28 h range. (H) Diagram of components of the quantitative model (see "Methods" for details).

