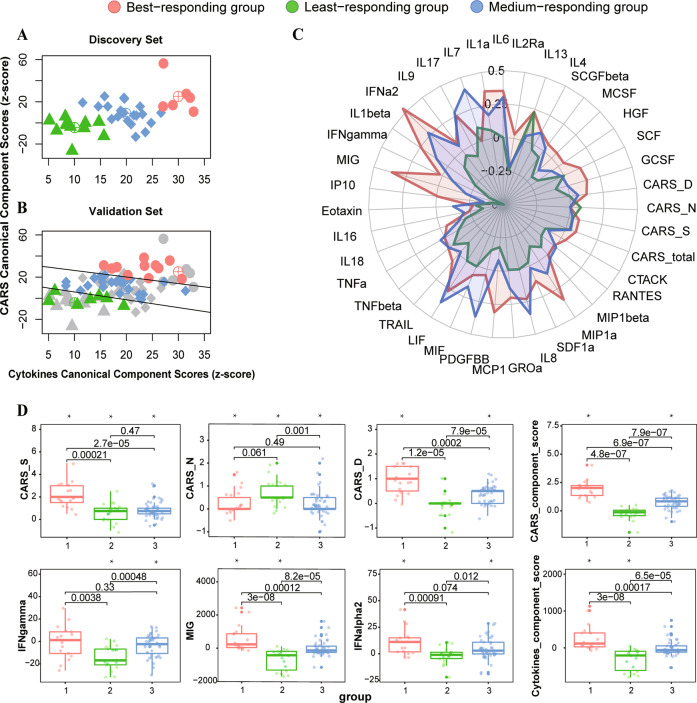
Fig. 2. Differences in three immuno-behavioural groups.
K-means cluster plot on the immuno-behavioural plane. K-means cluster analysis was carried out in Discovery Set (A) and the patients from the Validation Set were mapped to this immuno-behavioural plane (B). C Radar chart for the ratios of changes to baseline of CARS and cytokine levels in 3 immuno-behavioural groups. D Boxplot for the significant changes of CARS and cytokine levels in 3 immuno-behavioural groups.

