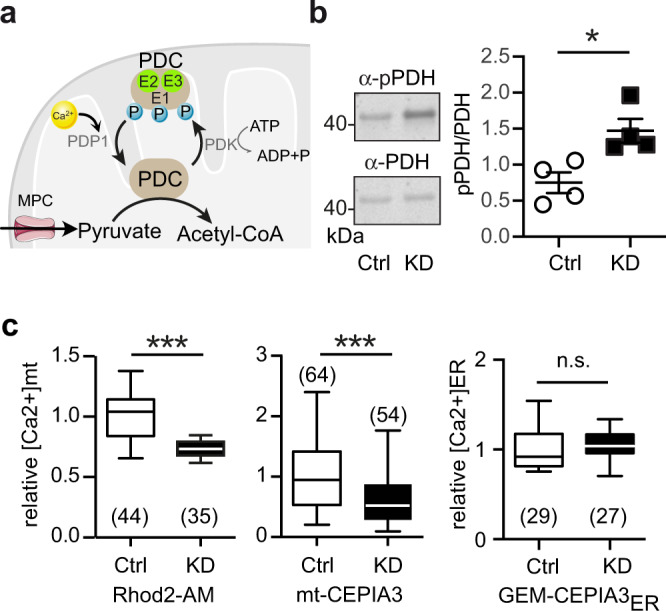
Fig. 3. Hyperphosphorylated pyruvate dehydrogenase and reduced mitochondrial Ca2+ levels in GDAP1 KD cells.

a Scheme showing the regulation of the pyruvate dehydrogenase complex (PDC). The PDC E1 subunit can be phosphorylated by the catalytic activity of the PDH kinase (PDK). The PDH phosphatase subunit 1 (PDP1) in turn dephosphorylates the serine residues upon activation by Ca2+. MPC, mitochondrial pyruvate carrier;PDK1, pyruvate dehydrogenase kinase 1. b Immunoblots from whole cell lysates for quantification of PDH E1 phosphorylation (serine 293), normalized to total PDH E1 levels revealed increased phosphorylation of PDH in GDAP1 KD cells. c Mitochondrial Ca2+ measured with the fluorescent dye Rhod2-AM or mito-CEPIA normalized to mito-FarRed indicated reduced mt[Ca2+] levels. ER[Ca2+] levels measured with the genetically encoded Ca2+ sensor GEM-CEPIA3ER did not show any variation between the cell lines. Data in (c) were from 3 independent experiments with the indicated number of cells. Data for GEM-CEPIA3ER were from 2 independent experiments. Statistical variation is shown as scatter plots in (b) and Tukey boxplots in (c). Significance was calculated using the non-parametric Mann–Whitney in (b) and Student’s t test in (c), *p < 0.05, **p < 0.001, ***p < 0.0001.
