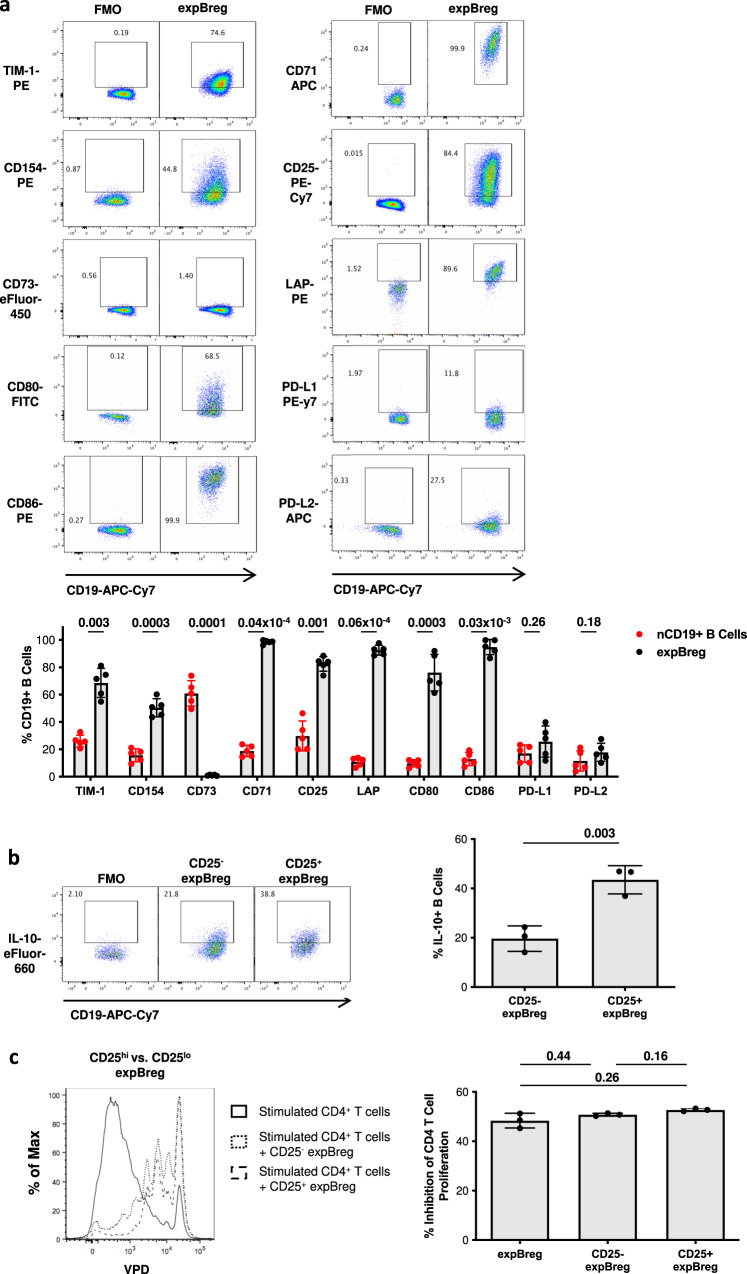
Fig. 3. expBreg resemble endogenous CD73−CD25+CD71+IL-10+ Breg, but suppressive function does not correlate with IL-10 expression.
a Representative FACS plots of live CD19+ B cells and summarised data demonstrating expression of cell-surface markers by expBreg. Gating is on FMO controls. % Expression is compared between expBreg and autologous non-expanded CD19+ B cells (nCD19+ B cells). Data from experiments performed with cells from different healthy donors (n = 5) are presented. Each dot is an individual response. Representative FACS plots of nCD19+ B cells are shown in Supplementary Fig. 3b. b Representative FACS plots of CD19+ expBreg and summarised data demonstrating expression of IL-10 are presented. Gating is on FMO controls. Data from experiments performed with cells from different healthy donors (n = 3) are presented. c Representative histograms of live CD4+VPD+ T cells and summarised data are presented when autologous CD4+VPD+ T cells and anti-CD3/CD28 beads were co-cultured alone or with CD25+ or CD25− expBreg. Data from experiments performed with cells from different healthy donors (n = 3) are presented. Each dot is an individual response. Error bars in each panel represent Mean ± SD (a–c) 2-tailed paired t tests (a, b) and one-way ANOVA with Tukey’s multiple comparisons tests (c) were used. Source data are provided as a Source Data file.

