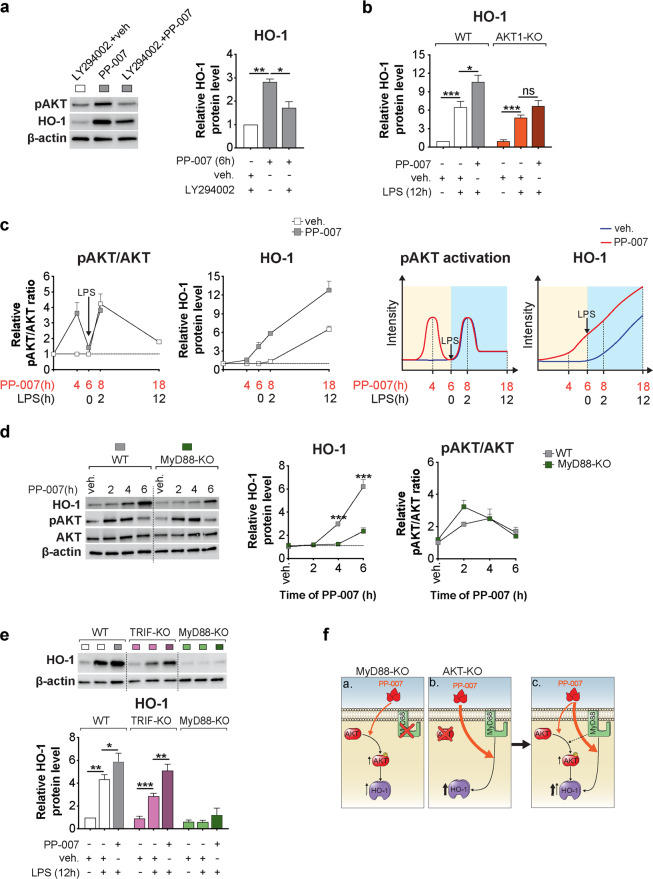
Fig. 2. PP-007 requires the combined activation of MyD88 and PI3K/AKT for optimal induction of HO-1.
a Representative WB of phospho-AKT (pAKT, serine 473) and HO-1 and densitometric analysis of HO-1 in WT MΦs pretreated for 12 h with 20 μM LY294002 or DMSO and then exposed to vehicle or 2 mg/ml PP-007 for an additional 6 h, as indicated. b Densitometric analysis of HO-1 in WT and AKT1-KO MΦs pretreated with vehicle or 2 mg/ml PP-007 for 6 h and then challenged with PA-LPS for 12 h. c Densitometric analysis of pAKT, total AKT, and HO-1 in murine WT MΦs treated with vehicle or PP-007 at different time points before and after the addition of PA-LPS (left). Schematic representation of the effects of PP-007 on AKT phosphorylation and HO-1 induction in MΦs before and after LPS addition (right). d Representative WB and densitometric analysis of HO-1, pAKT, and total AKT in WT and MyD88-KO MΦs treated with 2 mg/ml PP-007 for the time indicated. Time 0 indicates samples treated with vehicle. e Representative immunoblot and densitometric analysis of HO-1 in WT, TRIF-KO, and MyD88-KO MΦs pretreated with vehicle or 2 mg/ml PP-007 for 6 h and then challenged with PA-LPS for 12 h. f Schematic representation of the mechanism of action of PP-007: activation of the adaptor MyD88, but not PI3K/AKT signaling activation alone, is strictly required for robust PP-007-mediated induction of HO-1 (a, b). The combination of MyD88 and PI3K/AKT signaling activation led to the maximum induction of HO-1 (c). For WB data, band intensities were normalized to the corresponding β-actin band intensity, and the rate of AKT phosphorylation is shown as the ratio of phosphoprotein to total protein. Unless otherwise indicated, data are presented as the fold increase relative to WT vehicle-treated samples. Data are represented as the mean ± SEM of at least three biological repeats. Statistical analyses were conducted using a two-tailed unpaired Student’s t test with unequal variance: *P ≤ 0.05, **P < 0.01, and ***P < 0.001. In (d), * symbols indicate a statistically significant difference between different genotypes. Cropped blots are displayed, and full-length gels and blots are included in the Supplementary Methods.

