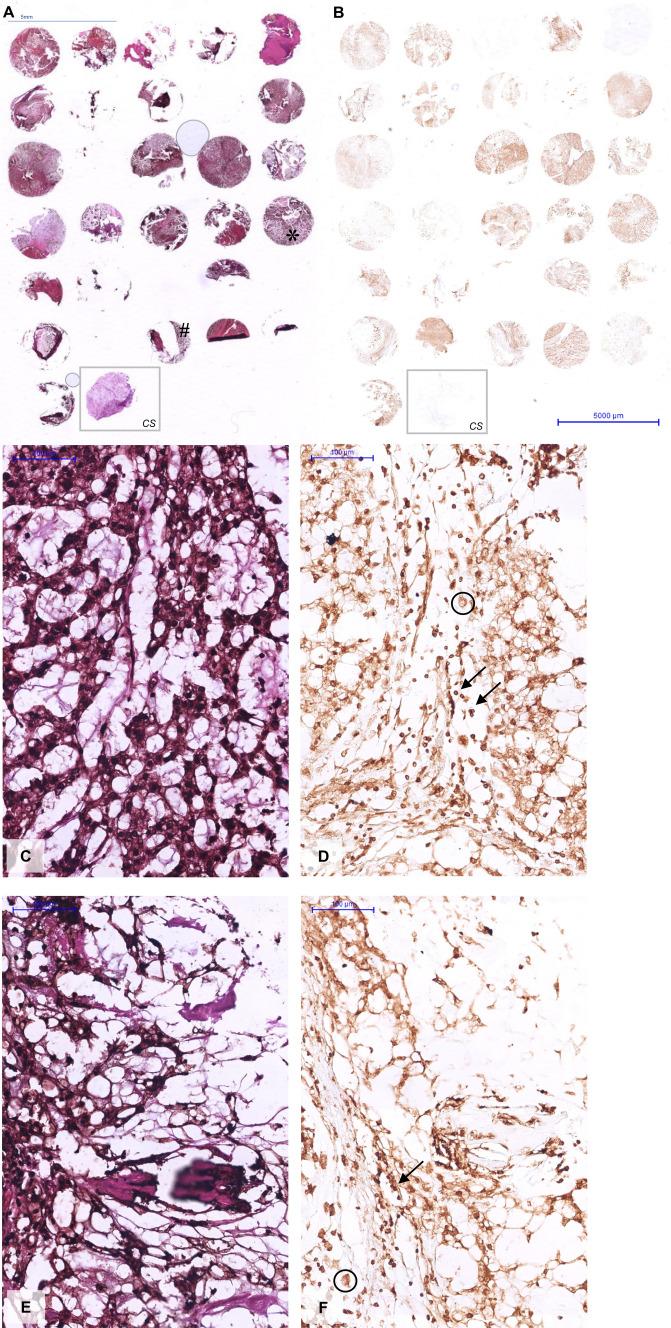
Fig. 2.
Tissue micro arrays of chordoma cores from 31 patients and a chondrosarcoma core (CS; within the grey rectangle) from 1 patient that were H&E stained (A). The adjacent section of the respective patient samples was immunohistochemically stained for LASP1 (B), showing a clear expression in most chordoma samples yet no signal in the CS sample. Enlargements of * and # show LASP1 expression in both the nucleus (black arrows; D–F) and the cytoplasm (black circles; D–F). Magnification 40X

