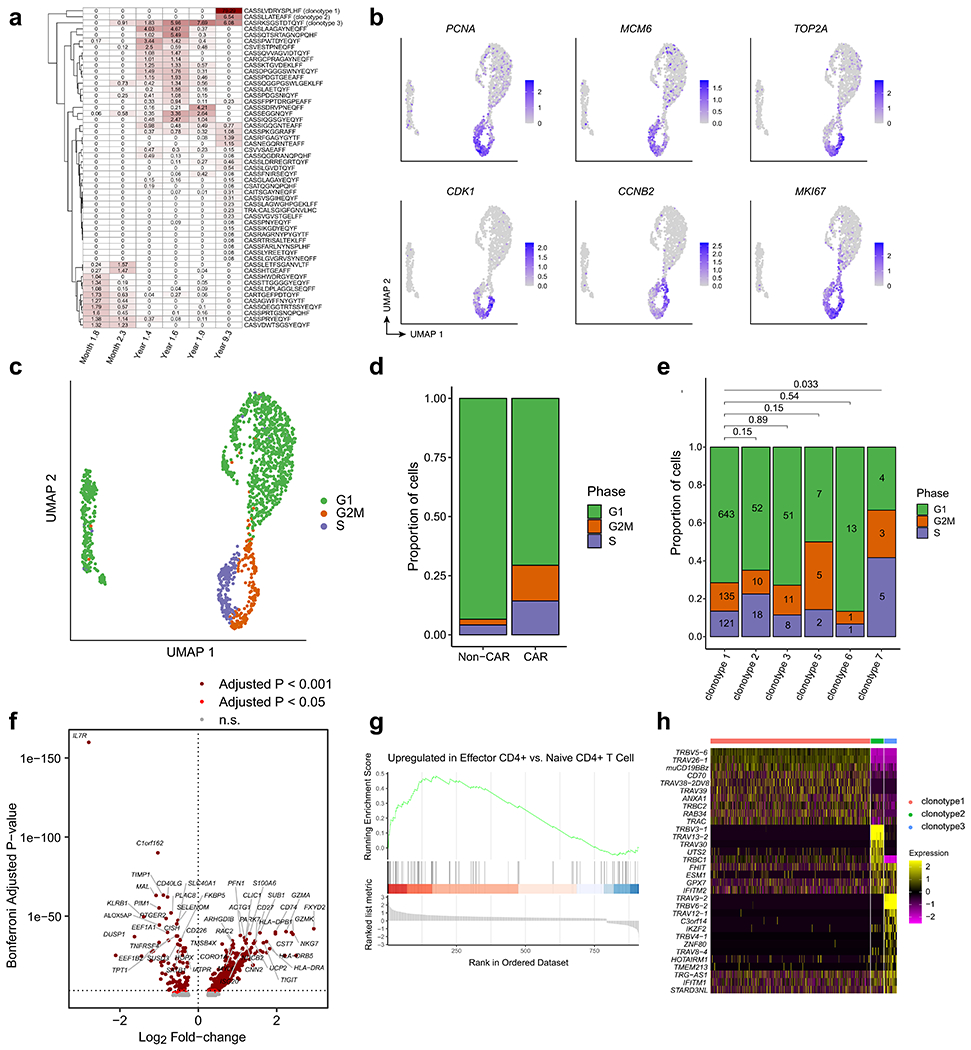
Extended Data Fig. 6 |. Analysis of CAR T-cell clonotype, cell cycle, and differential gene expression from patient 1 at year 9.3.

a, Heatmap showing the relative frequencies of TCR clonotypes at the 2-month, 3-month, 15-month, 18-month, 21-month, and 9-year time points. Note that the first five columns were estimated from bulk TCR sequencing, whereas the rightmost column was estimated from the single-cell TCR/CITE-Seq data from year 9. b, UMAPs indicating strong up-regulation of RNA expression of cell cycle genes. c, UMAP colored by cell cycle phase using Seurat. d, Proportions of cells in each cell cycle phase, compared between CAR− T and CAR+ T cells. Chi-squared p-value = 8.97e-15. e, Proportions of cells in each cell cycle phase, compared between the top six CAR T-cell clonotypes. Pairwise statistical significance was assessed with the Chi-Squared test, and multiple-testing correction was performed using the Benjamini-Hochberg method. Numbers within the bars indicate the number of cells observed. f, Volcano plot indicating genes up-regulated in CAR T-cells compared to normal CD4+ T cells (rightward direction) and genes down-regulated in CAR T-cells compared to normal CD4+ T cells (leftward direction). Differentially expressed genes were determined using the Wilcoxon rank-sum test with a Bonferroni-adjusted p-value cutoff of 0.001 (dark red) and 0.05 (red). g, Gene Set Enrichment Analysis plot for the effector CD4+ gene signature. h, Heatmap indicating normalized gene expression values for the 32 differentially expressed genes with a Bonferroni-adjusted p-value cutoff of 0.001.
