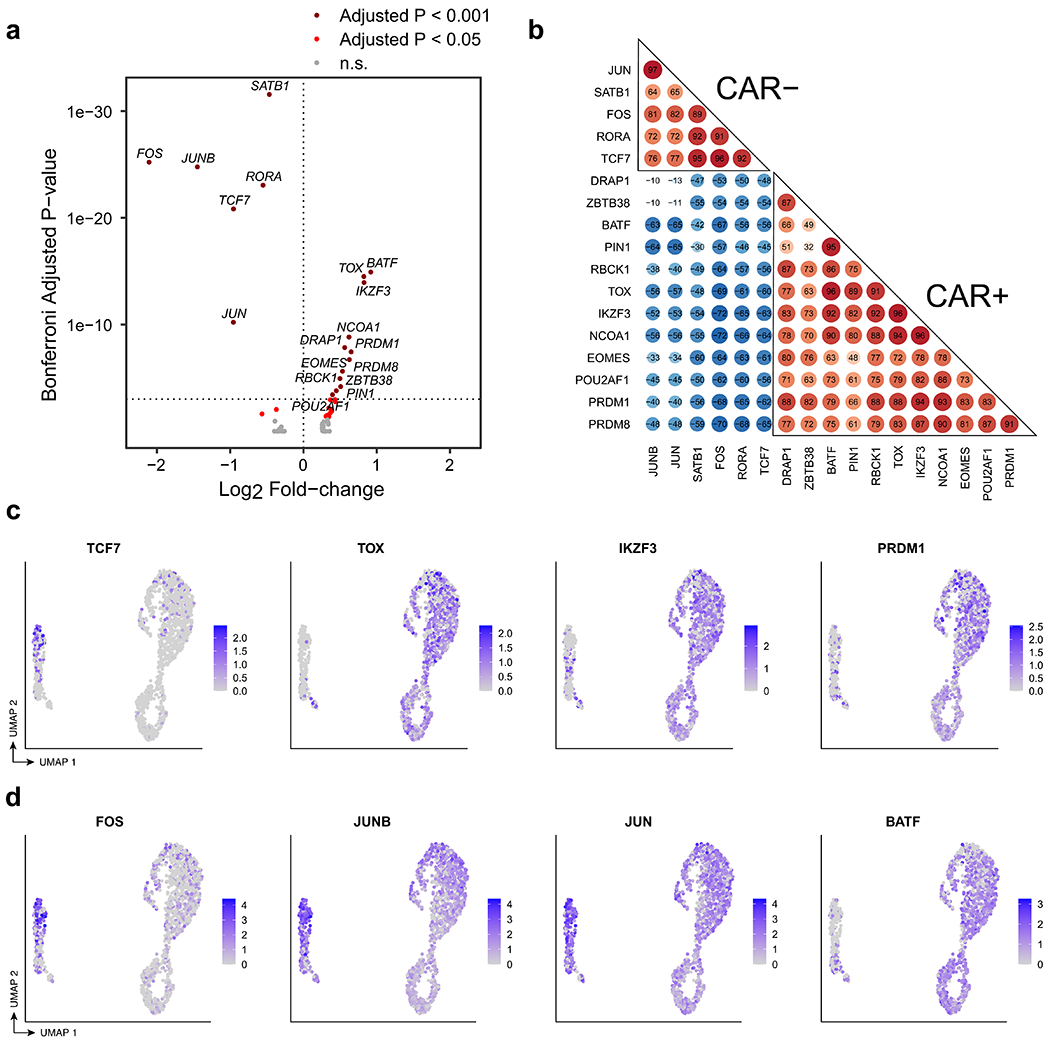
Extended Data Fig. 9 |. Transcriptional regulation of CAR T-cells in patient 1 at year 9.

a, Volcano plot indicating transcription factors (TFs) up-regulated in CAR T-cells compared to normal CD4+ T cells (rightward direction) and TFs down-regulated in CAR T-cells compared to normal CD4+ T cells (leftward direction). Differentially expressed TFs were determined using the Wilcoxon rank-sum test with a Bonferroni-adjusted p-value cutoff of 0.001 (dark red) and 0.05 (red). b, Pairwise correlation of TF regulon scores determined by GENIE3 and AUCell in the comparison between CAR T-cells and CD4+ CAR− T cells. c, UMAP indicating RNA expression of selected differentially expressed TFs TCF7, TOX, IKZF3, and PRDM1. d, UMAP indicating RNA expression of differentially expressed AP-1 TFs, FOS, JUNB,JUN, and BATF.
