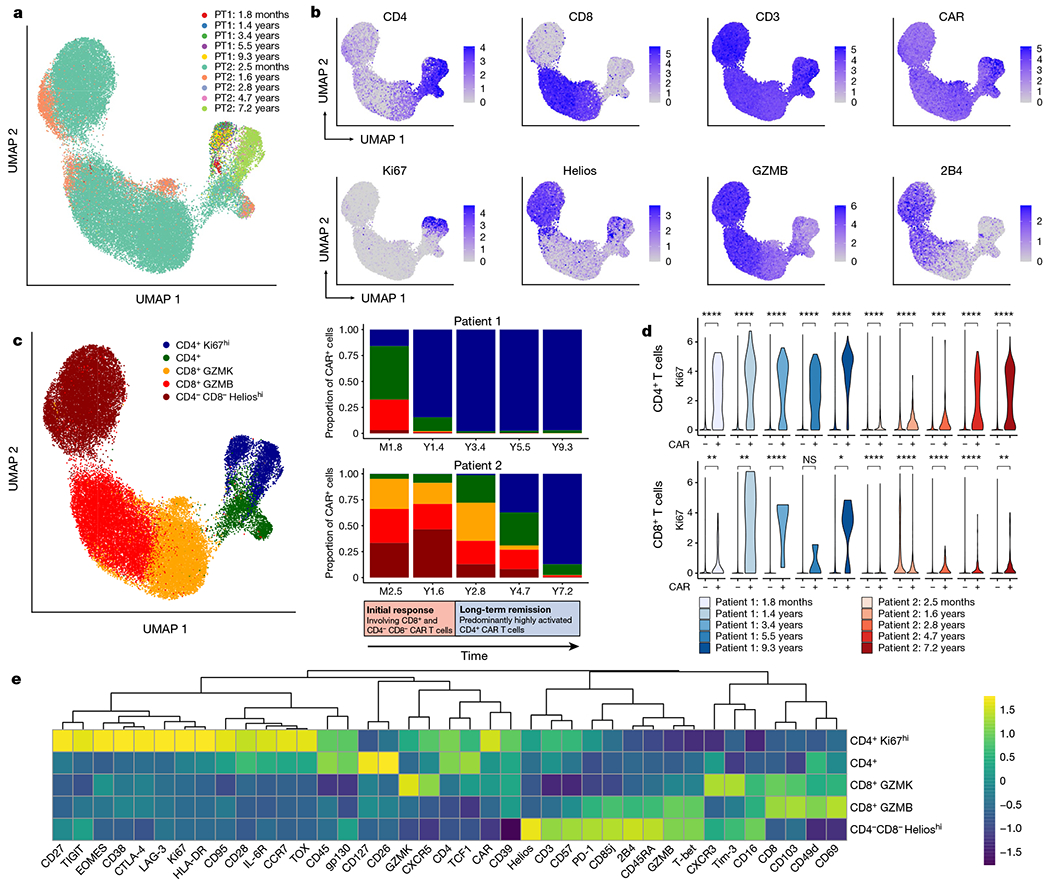
Fig. 2 |. Analysis of CD3+ CAR+ T cells using CyTOF across multiple time points.

a, Uniform manifold approximation and projection (UMAP) of CD3+CAR+ gated cells from CyTOF data generated from samples at five time points for each of patient 1 (PT1) and patient 2 (PT2). Each colour represents cells from one patient time point after infusion. b, Protein expression of selected CyTOF markers, revealing a prominent Ki67hi population of CD4+ CAR T cells, as well as a CD4−CD8− population expressing Helios, GZMB and 2B4. c, UMAP grouped by five major clusters of CAR T cells: a CD4+Ki67hi population, a CD4+ population without this Ki67hi phenotype, a CD8+ population highly expressing GZMK, a CD8+ population highly expressing GZMB, and a CD4−CD8− population expressing Helios. The adjacent stacked bar plots indicate the proportion of each CAR T cell population at different time points, revealing an initial response phase involving CD8+ and CD4−CD8− CAR T cells, followed by a long-term remission stage dominated by this CD4+Ki67hi population. This transition to CD4+Ki67hi CAR T cells was more delayed in patient 2 compared with patient 1. d, Ki67 expression in CD4+CAR+ and CD4+CAR− cells; and CD8+CAR+ and CAR− cells across time points. Statistical testing was performed using the Wilcoxon rank-sum test. ****P < 0.0001; ***P < 0.001; **P < 0.01; *P < 0.05; NS, not significant (P > 0.05). e, Heat map indicating z-score normalized expression of CyTOF markers across five major CAR T cell clusters.
