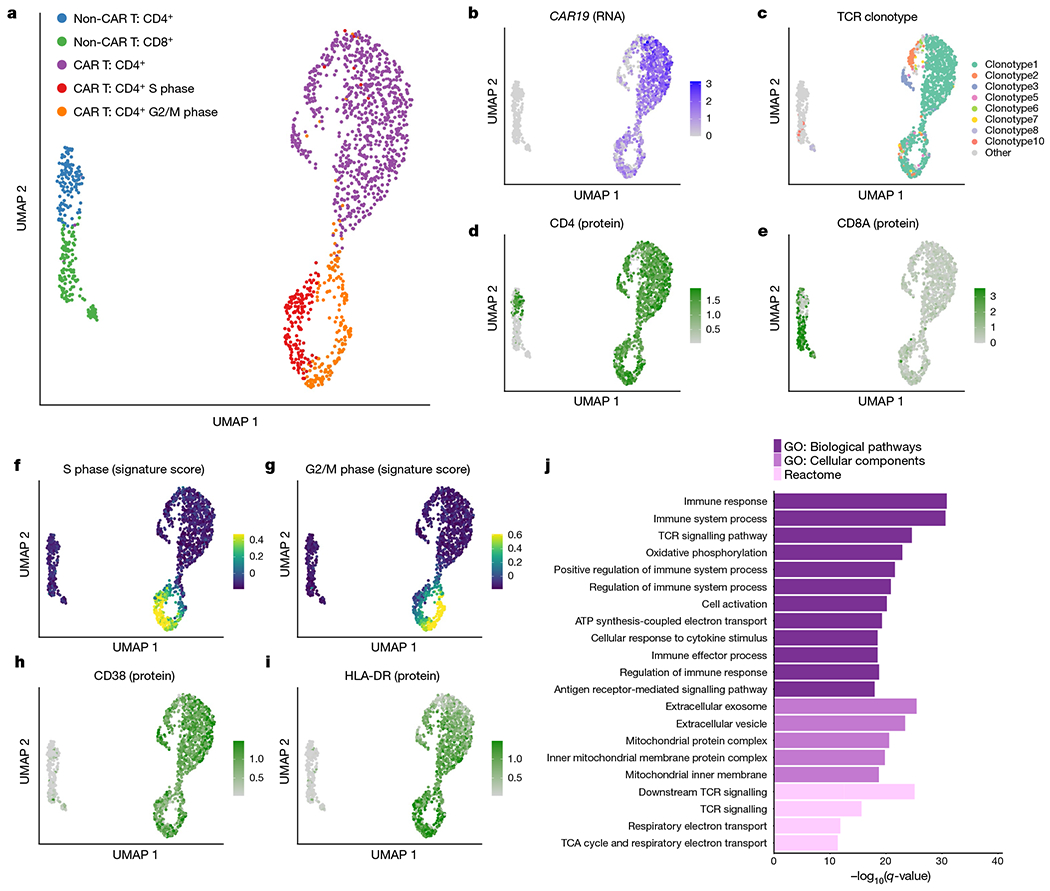
Fig. 3 |. Multi-omic single-cell analysis reveals clonal expansion, proliferation and activation in CAR T cells from patient 1 at year 9.3.

a, UMAP of 1,437 T cells sorted from peripheral blood from patient 1 at year 9.3. UMAP coordinates were computed using the single-cell RNA-seq component of the 5’ TCR-seq and CITE-seq protocol. b, Normalized expression of the CAR construct detected from 5’ single-cell RNA-seq reads. c, UMAP coloured by the eight detected TCR clonotypes with at least ten cells each. Minor clusters with fewer than ten detected cells were coloured light grey. d, e, Normalized CITE-seq antibody expression for the CD4 (d) and CD8a (e) proteins. f, g, Cell cycle scores for cells in the S phase (f) or G2/M (g) phases. h, i, Normalized CITE-seq antibody expression for the activation markers CD38 (h) and HLA-DR (i). j, Gene set enrichment analysis for genes significantly upregulated in CD4+CAR+ T cells compared with CD4+CAR− T cells. Gene Ontology (GO) biological pathways and cellular components and Reactome pathways were considered. TCA, tricarboxylic acid.
