
Extended Data Fig. 7. Genomic comparative analysis of genetic polymorphisms in CPH1, UME6, FLO8 and ECE1 among high- and low-damaging strains.
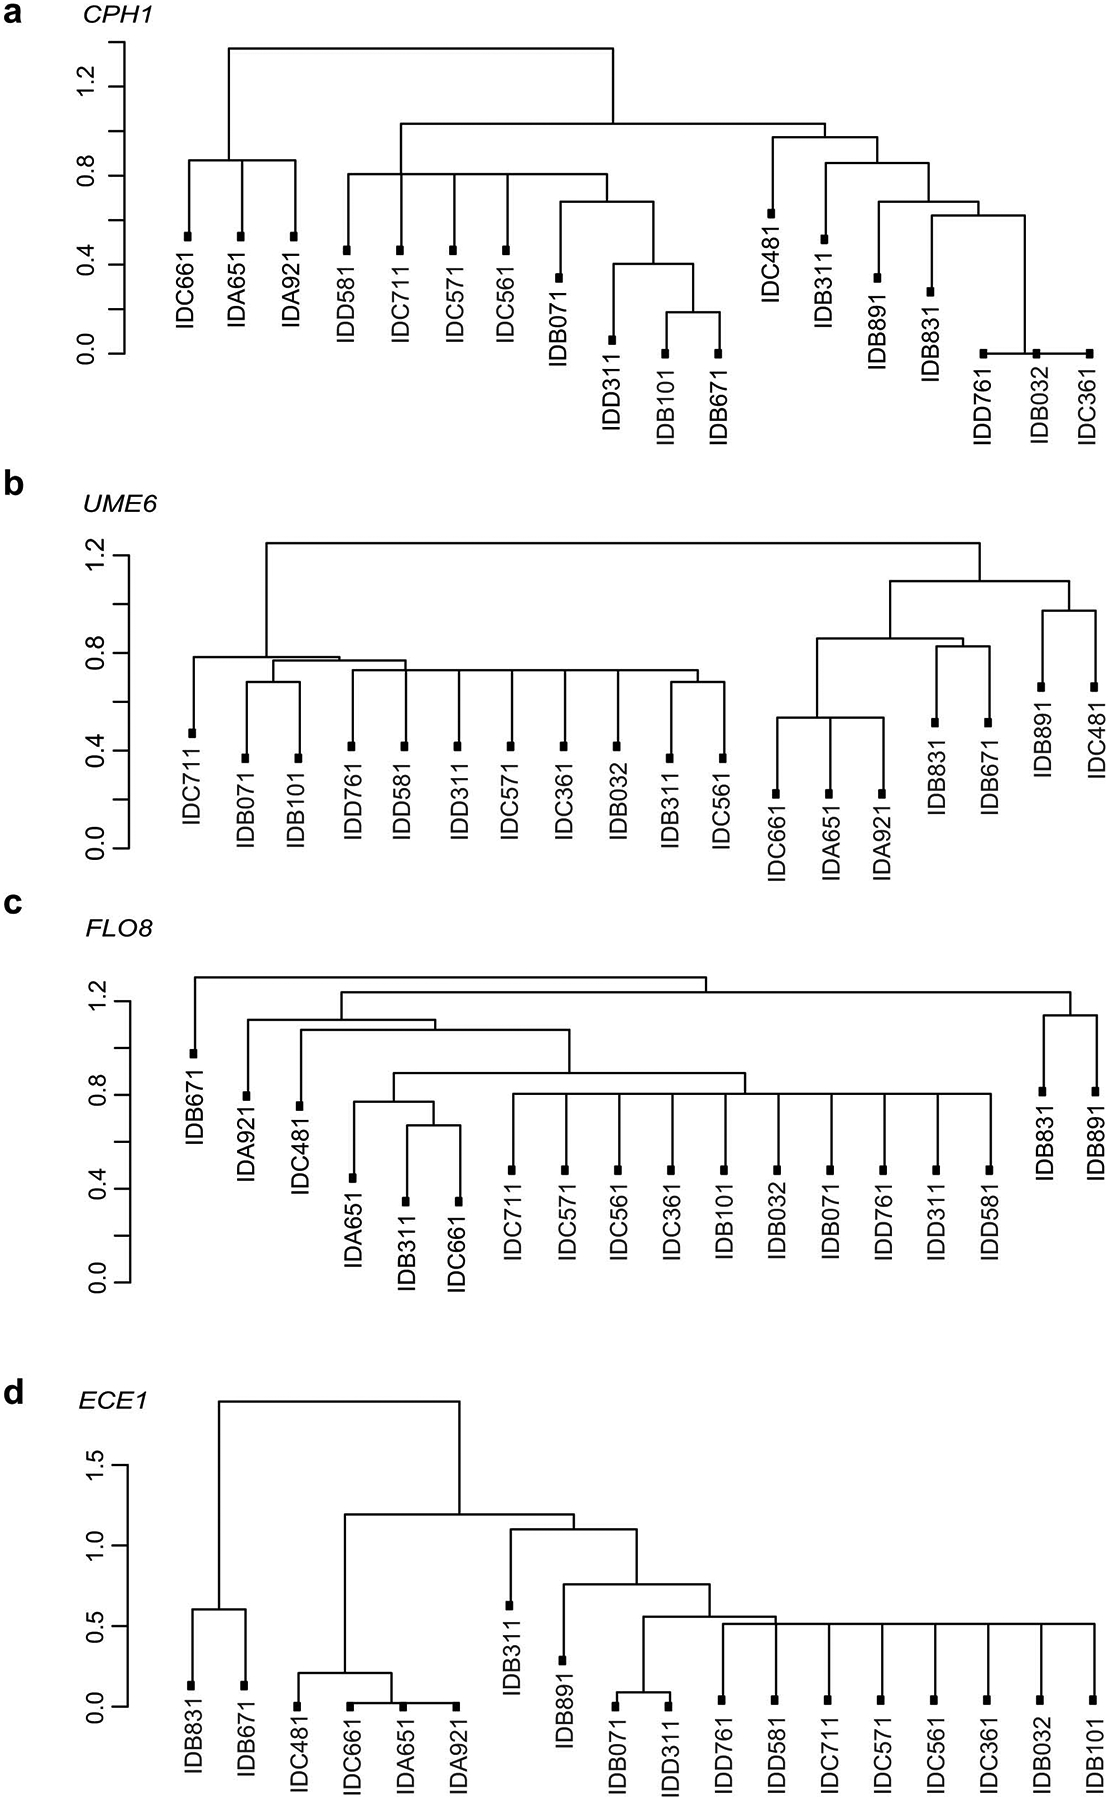
a-c, Dendrogram showing SNP-based distances between CPH1 (a), UME6 (b), FLO8 (c) and ECE1 (d) sequences of isolates. Each isolate was obtained from an individual subject from the non-IBD (n=8) or UC patient (n=10) group.