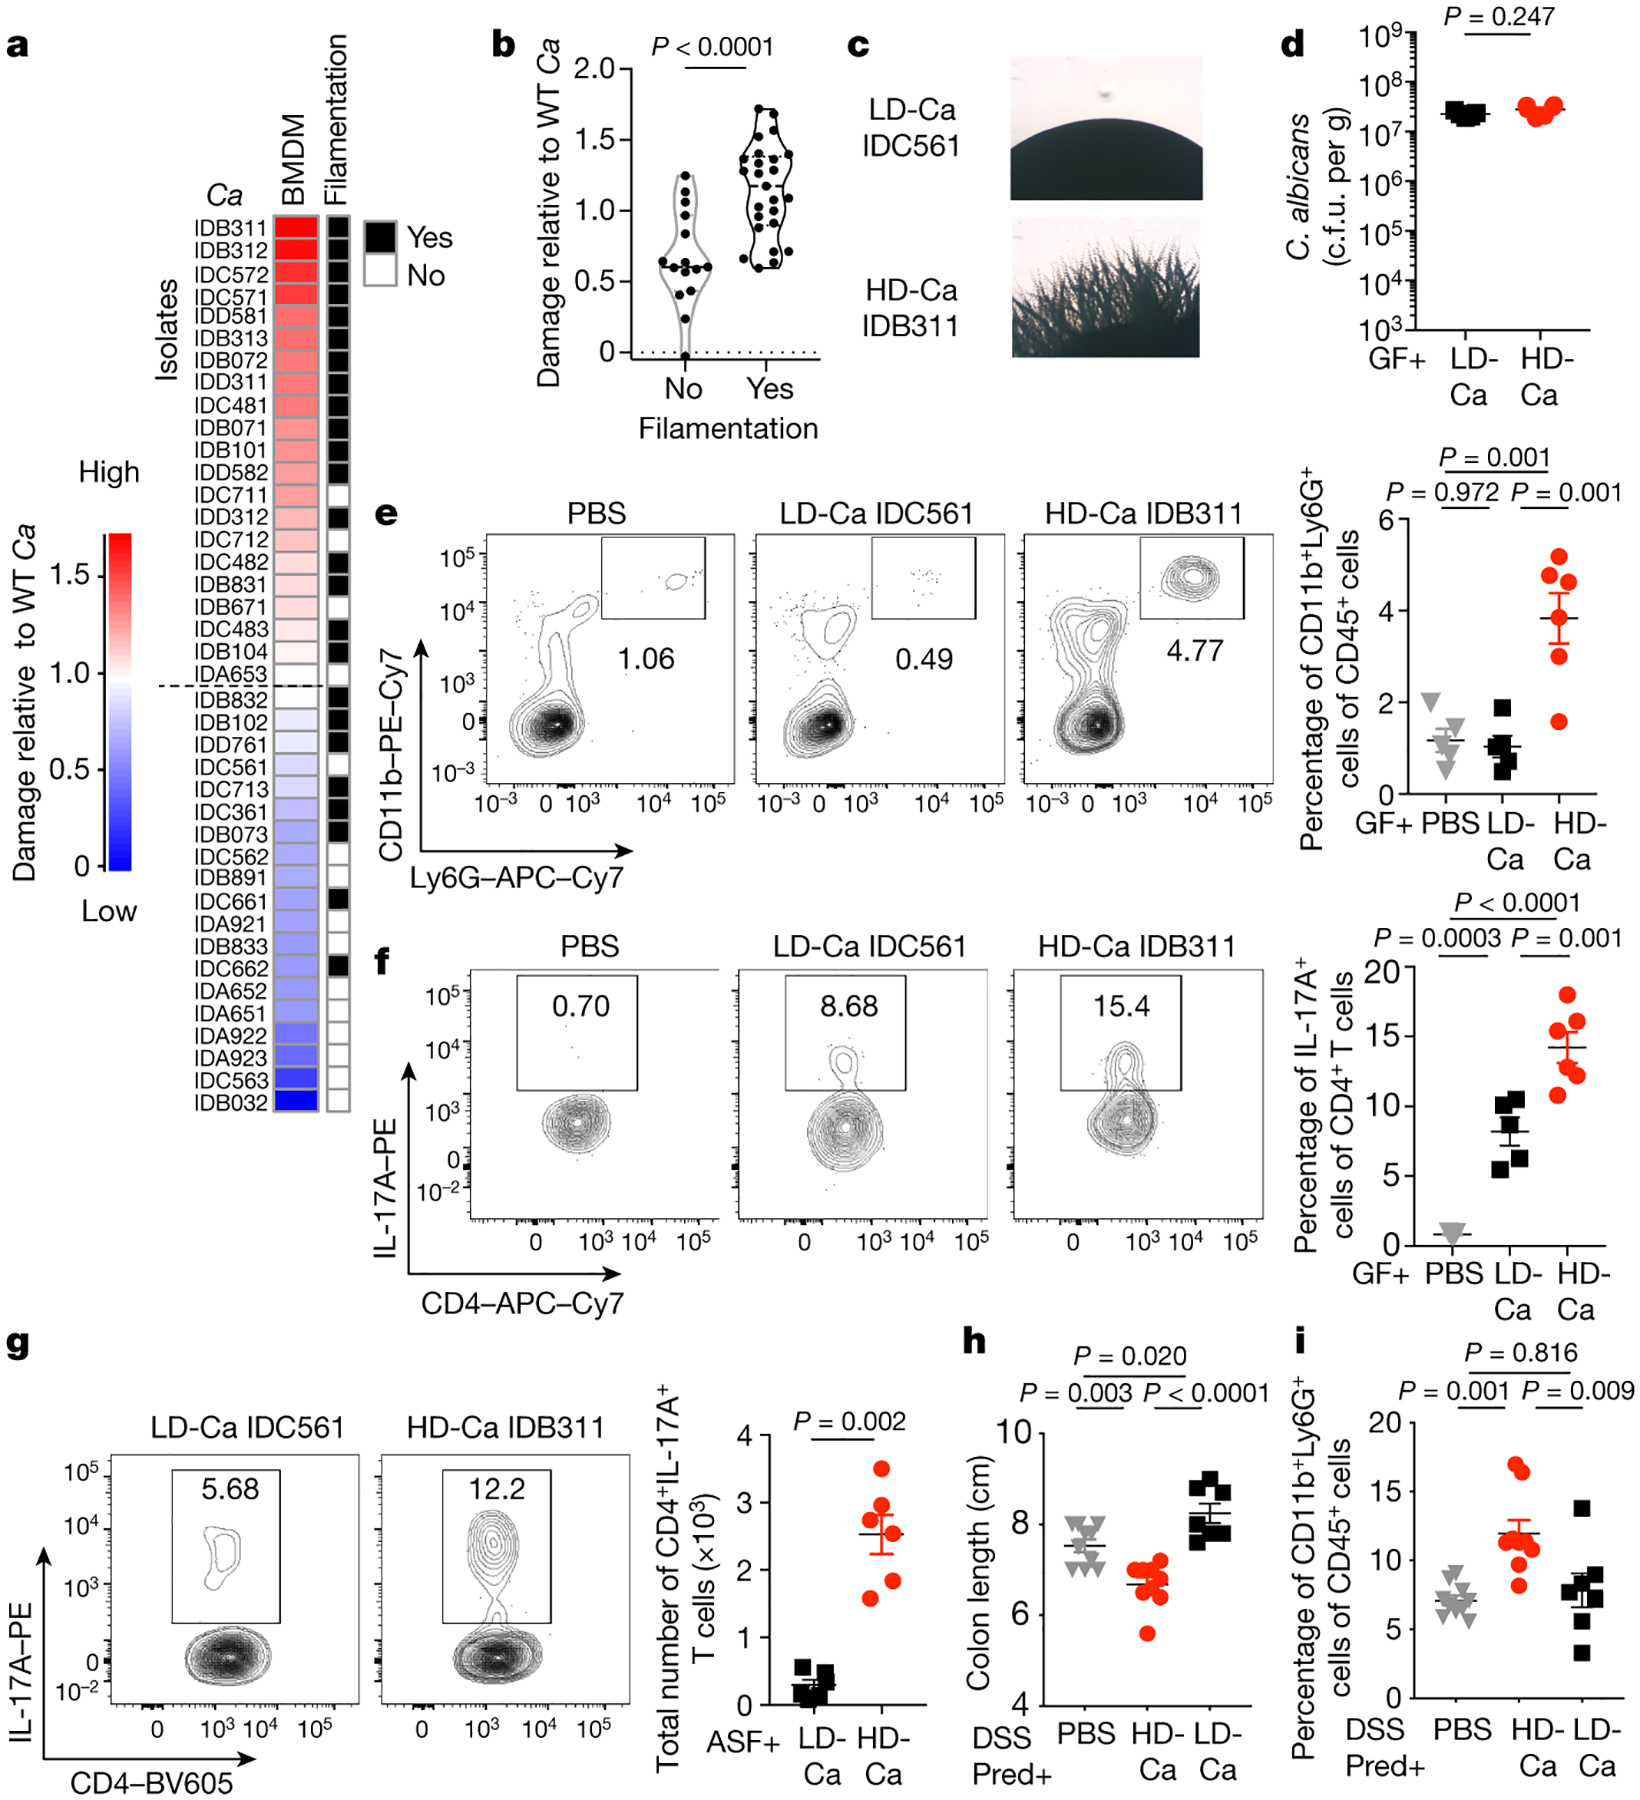
Figure 2. Cell damage and proinflammatory immunity induced by human gut-derived C. albicans is strain-dependent.

a, mBMDM were infected with C. albicans (C.a) isolates (three isolates per individual; MOI=5) for 16 hours, and cytotoxicity (LDH release as compared to SC5314) was measured. Data are shown as an average value of three technical repeats. b, Filamentation phenotype of each isolate was determined in a spider agar assay and compared the capacity of C. a isolates to induce damage of mBMDM (LDH assay). Results are shown as mean ± s.e.m. a-b, Data are representative of three independent experiments with similar results. c, Representative images of LD/C.a; IDC561 and HD/C.a; IDB311. d-f, WT germ-free (GF) mice were colonized with C.a strains for three weeks. PBS (n=5), LD/C.a (IDC561, n=5), HD/C.a (IDB311, n=6). d, Fecal C. albicans burden was measured at day 21. e-f, Representative flow cytometry plots and quantification of CD11b+Ly6G+ neutrophils and CD4+IL-17A+ Th17 cells in the colon. g-i, ASF mice were colonized with C.a strains for three weeks. PBS (n=6), LD/C.a (IDC561, n=6), and HD/C.a (IDB311, n=6). g, Total numbers of colonic CD4+IL-17A+ Th17 cells. h-i, SPF WT mice were with C.a strains colonized and treated with prednisolone followed by DSS-induced murine colitis. PBS (n=10), HD/C.a IDB311 (n=9) and LD/C.a IDC561 (n=7). h, Colon length. i, Frequencies of CD11b+Ly6G+ neutrophils in the colon. Data in d-i are shown as mean ± s.e.m. Each dot represents an individual mouse. Data are representative of three (c-f) or two (g-i) independent experiments with similar results. Unpaired, two-tailed, Mann-Whitney test (b, d and g) or one-way ANOVA followed by the Tukey’s post hoc test (e, f, h and i).
