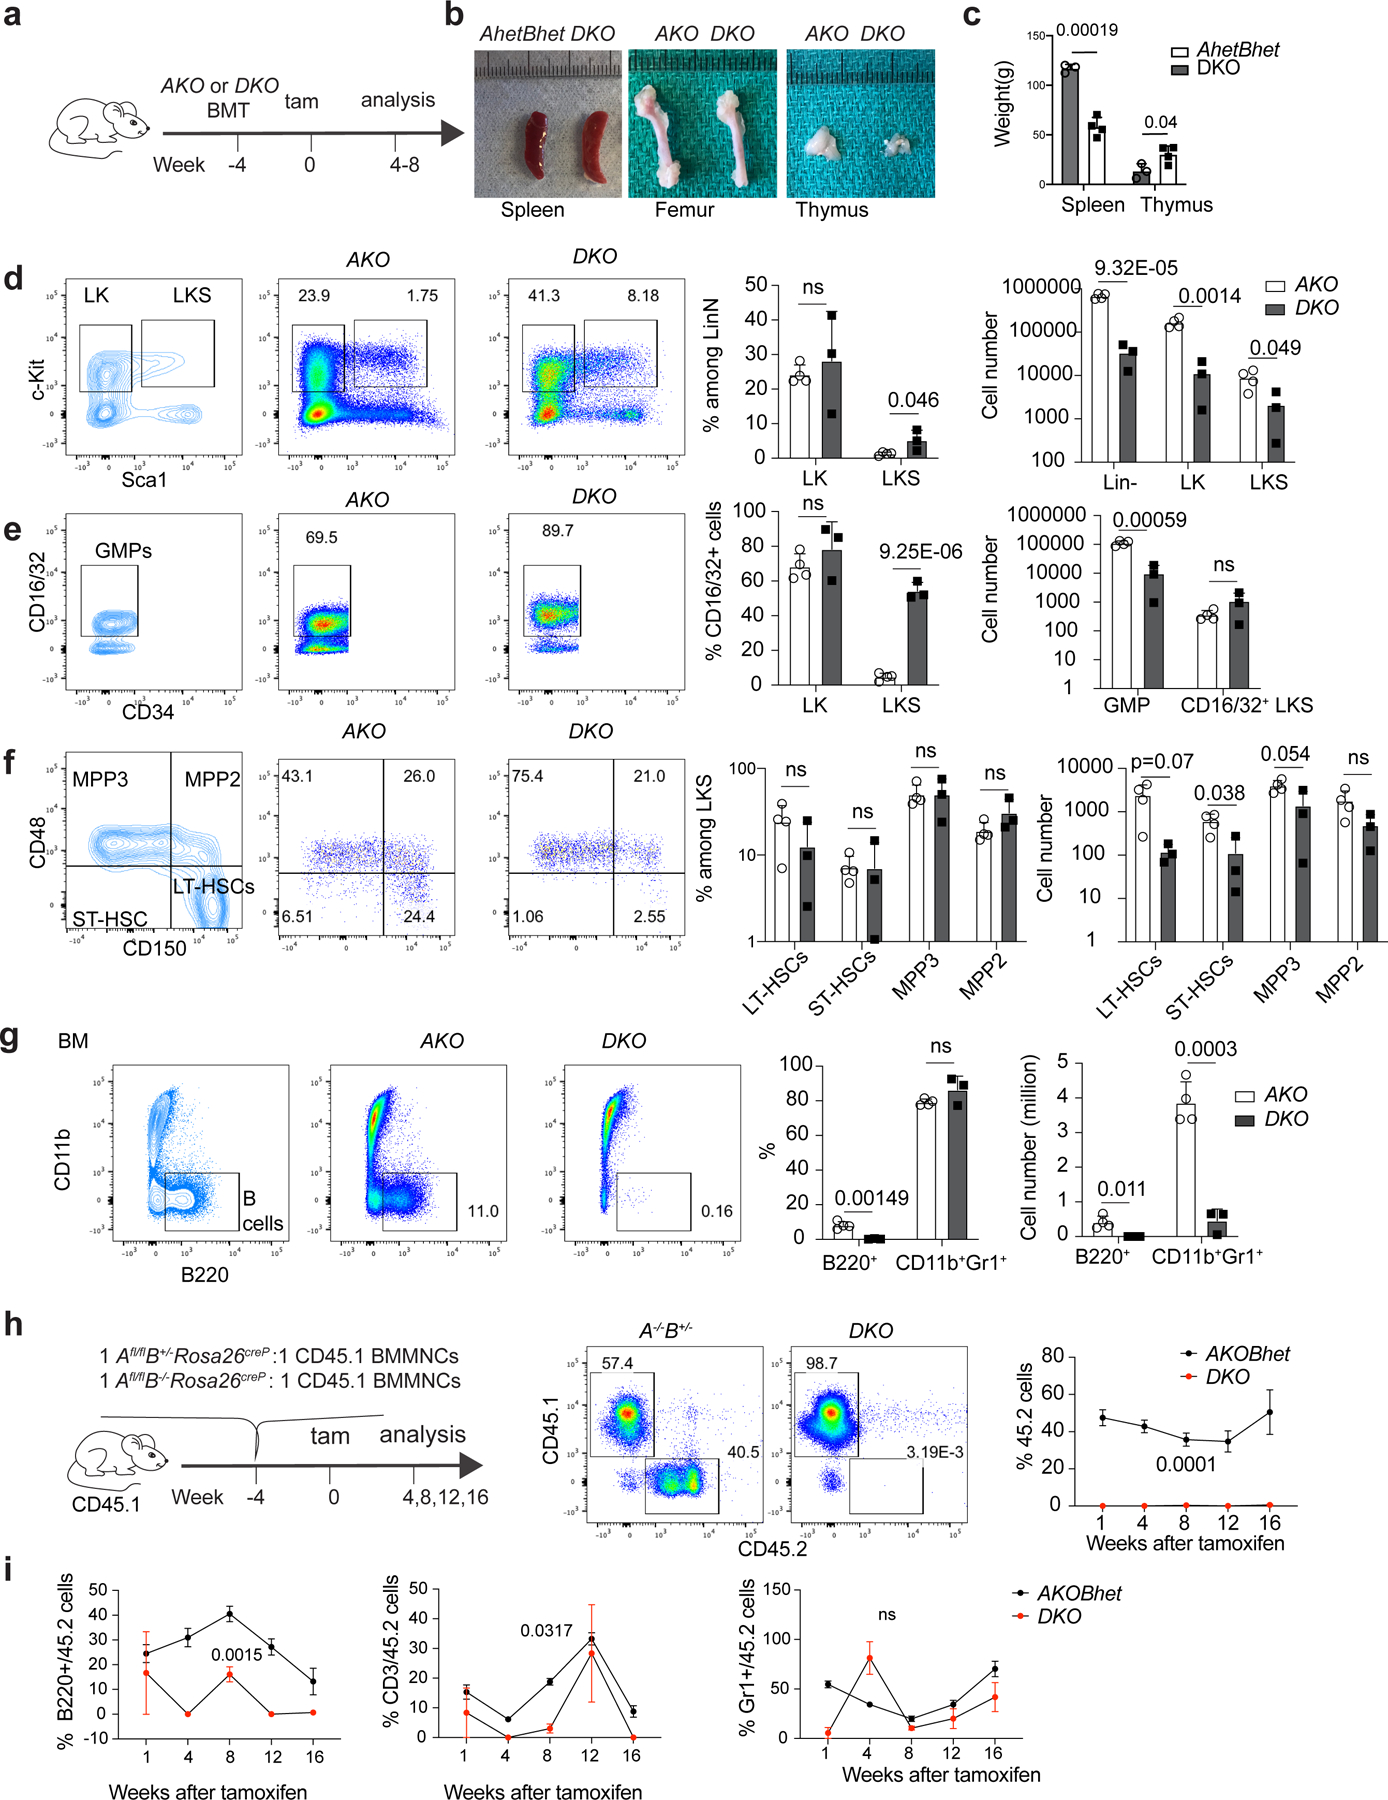
Fig. 1 |. H3.3 maintains adult haematopoiesis and HSC repopulation.

a, Schematic view of non-competitive transplantation experiments. b, Images of the spleen (left), femur (middle) and thymus (right) of the recipients transplanted with induced KO (iKO) including H3.3AiKO/iKO (AKO), H3.3AiKO/+H3.3B+/− (heterozygous H3.3A-KO and heterozygous H3.3B-KO; AhetBhet) or DKO BMMNCs at 4 weeks following tamoxifen treatment. c, Weight of the spleen and thymus of the recipients of AKO, AhetBhet or DKO BMMNCs. d, Representative flow cytometry plots (left), percentages (middle) and the total number of LKS cells (right) in the mice described in a. e, Representative flow cytometry plots (left), percentages (middle) and the total number of CD16/32+ CD34+c-Kit+Sca1−Lin− GMPs and CD16/32+ LKS cells (right) in the recipients described in a. f, Representative flow cytometry plots (left), percentages (middle) and the total number of MPP3, MPP2, LT-HSC and ST-HSC (right) cells in the recipients described in a. g, Representative flow cytometry plots (left), percentages (middle) and numbers (right) of B cells in the BM of the recipients described in a. a–g, n = 4 AKO mice and n = 3 DKO mice. h, Schematic of the competitive transplantation assay used to test the engraftment of DKO BMMNCs (left). Representative flow cytometry plots showing the percentage of CD45.2+ cells in the peripheral blood of the CD45.1 recipients (middle). Percentages of CD45.2+ cells in the peripheral blood of the CD45.1 recipients at different time points (right). i, Multilineage engraftment for the CD45.2+ BMMNCs cells from AKOBhet and DKO mice. h,i, n = 4 animals per experiment. The experiment was repeated twice. c–i, The P values were calculated using an unpaired two-tailed Student’s t-test (c–g) or a two-way analysis of variance (ANOVA; h,i) and are indicated on the graphs; NS, not significant. The error bars represent the s.e.m. d–h, The percentage of cells in the different quadrants or boxes in the flow cytometry plots are indicated. Tam, tamoxifen. Numerical source data are provided.
