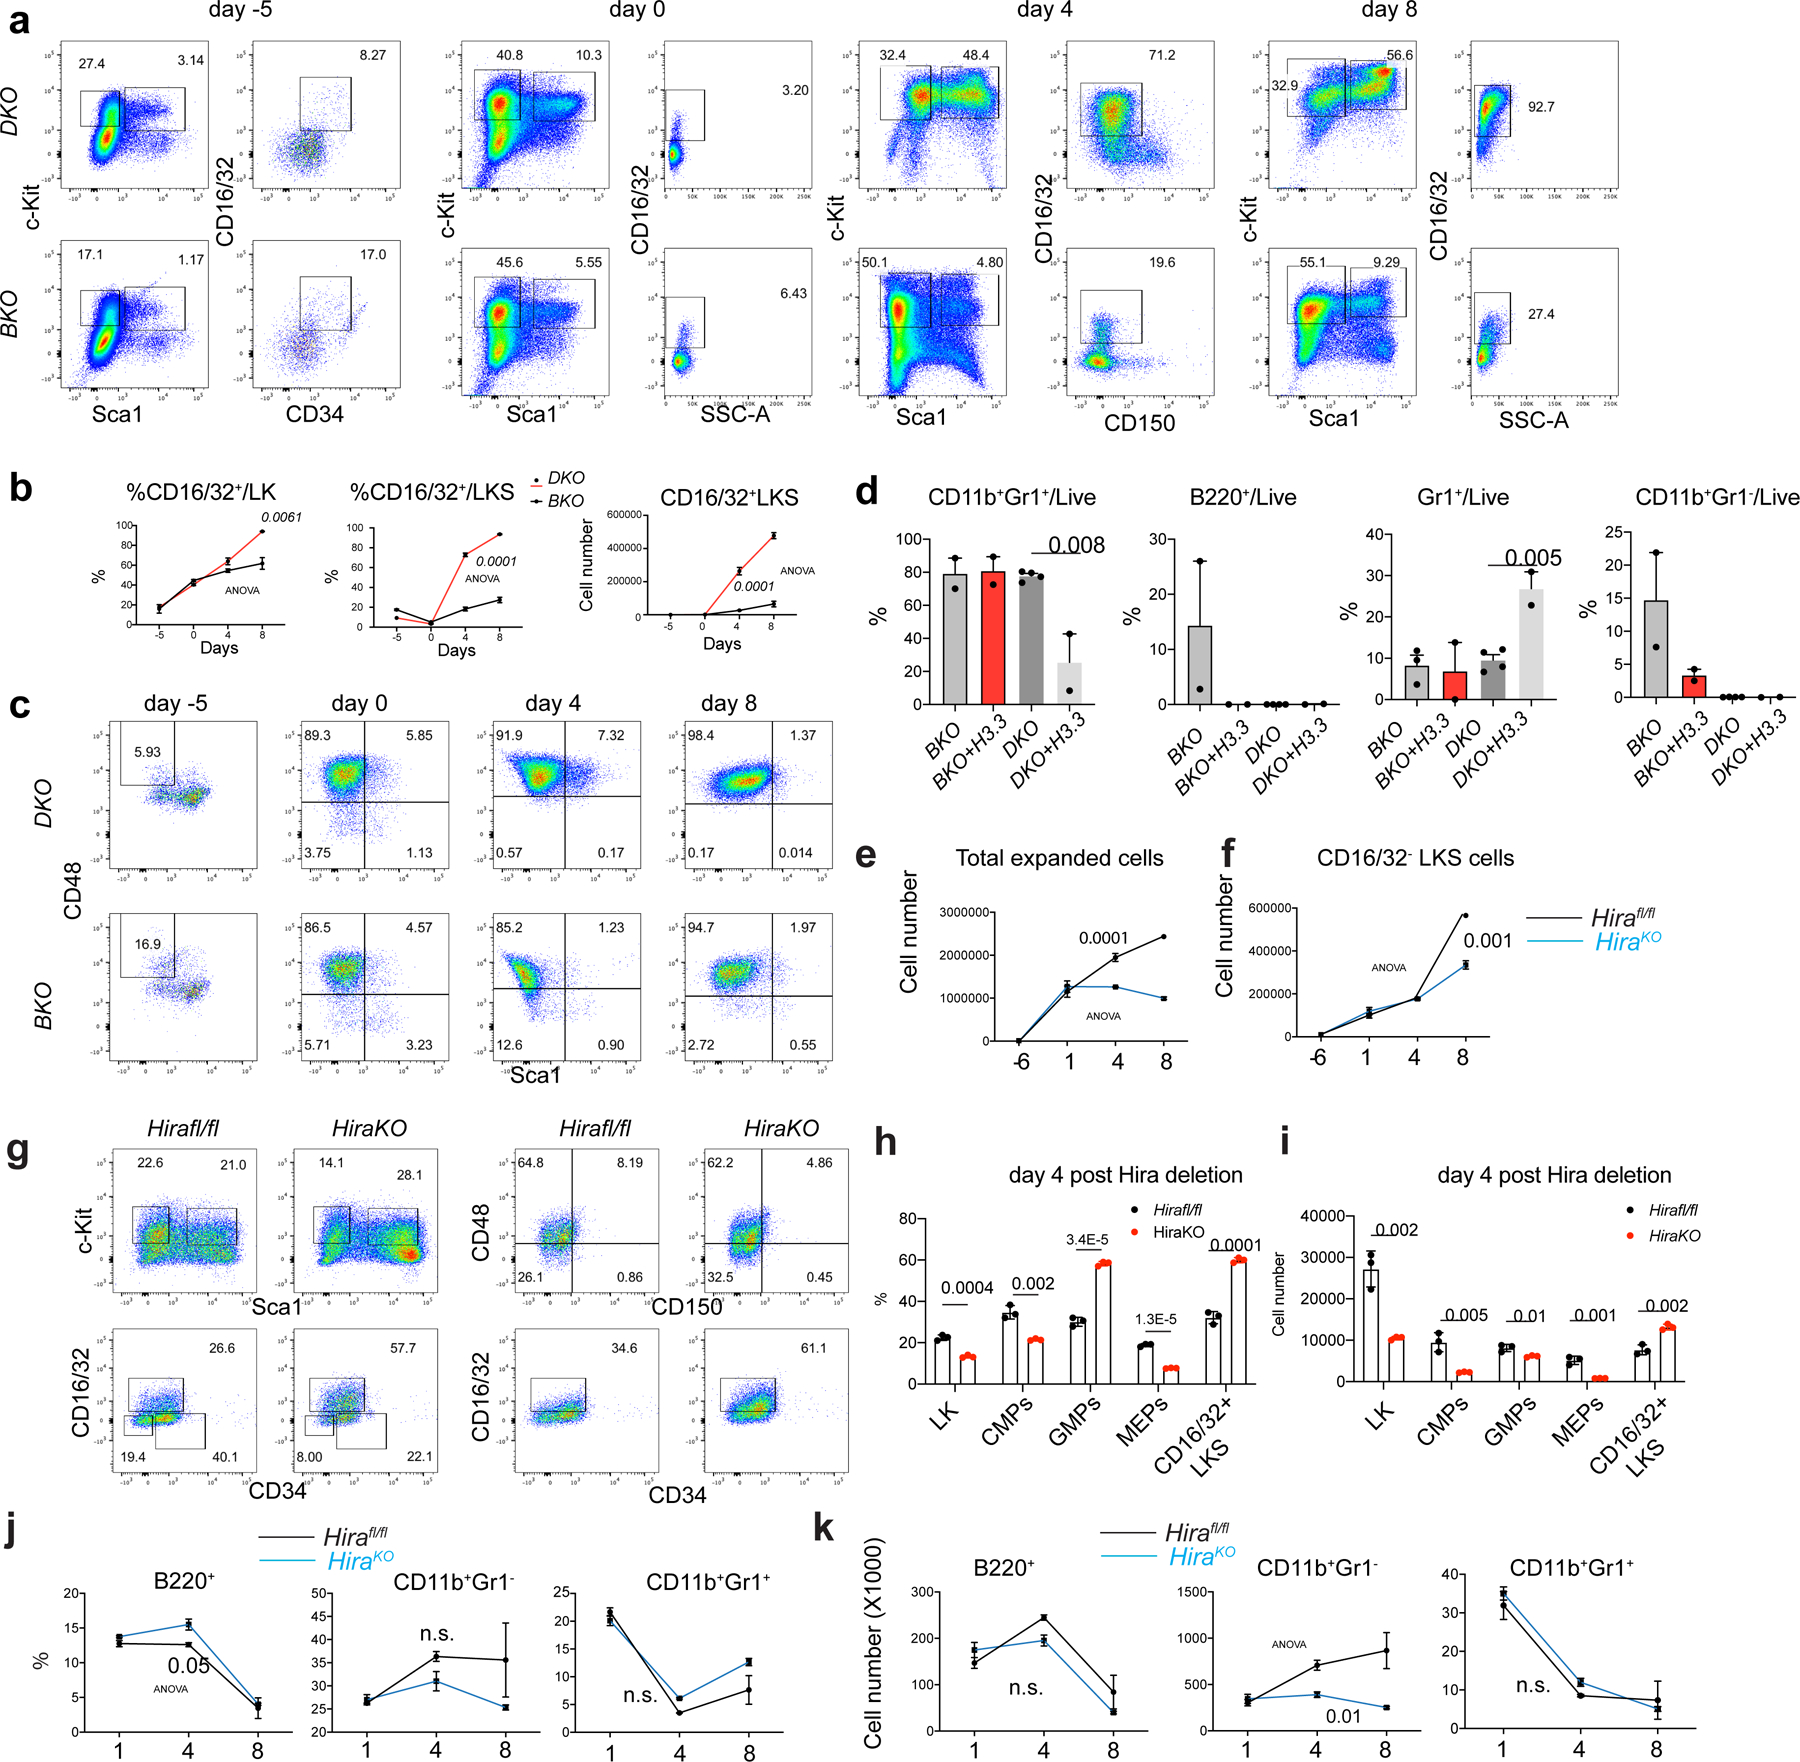
Extended Data Fig. 6 |. H3.3 prevents HSC myeloid differentiation.

a. Representative flow cytometric plots for the kinetics of LKS cell at different time points after tamoxifen treatment. Note the emergence of CD16/32+ LKS cells with the increase of culture time, and the elevated percentages of CD16/32+ cells in DKO LKS cells, compared with BKO LKS cells. b. percentages of the CD16/32+ among LK or LKS cells. c. Representative flow cytometric plots for the LT-HSCs during the co-culture. d. Lineage differentiation potential of BKO and DKO cells. There is reduced capacity for DKO to differentiate into B220+ B cells; overexpressing H3.3 did not rescue this defect. e. We set up in vitro culture assays for Hirafl/fl and Rosa26creERT2+ ;Hirafl/fl (HiraKO) HSCs. The growth curve of total hematopoietic cells are shown. f. the growth kinetics of total number of CD16/32+LKS cells. g. Representative flow cytometric plots for the LKS cells, LT-HSCs, GMPs, and CD16/32+ LKS cells in Hirafl/fl or HiraKO cultures. h-i, at day 4 after Hira deletion, the percentages and total numbers of LK, CMPs, GMPs, MEPs, and CD16/32+ LKS cells. j-k. the percentages and the total numbers of lineage cells, including B220+ B cells, CD11b+Gr1+ early myeloid cells, and CD11b+Gr1+ granulocytes. For panels 6b, d, e-f, h-k, the number of dots indicate the number of independent biological samples per experiment. Error bars indicate standard error of mean (SEM). For panels d, h, and i, P-values were calculated using unpaired, two-tailed, t-test; for panels b, e, f, j, and k, p-value was calculated using two-way ANOVA. Numerical source data are provided in Source Data.
