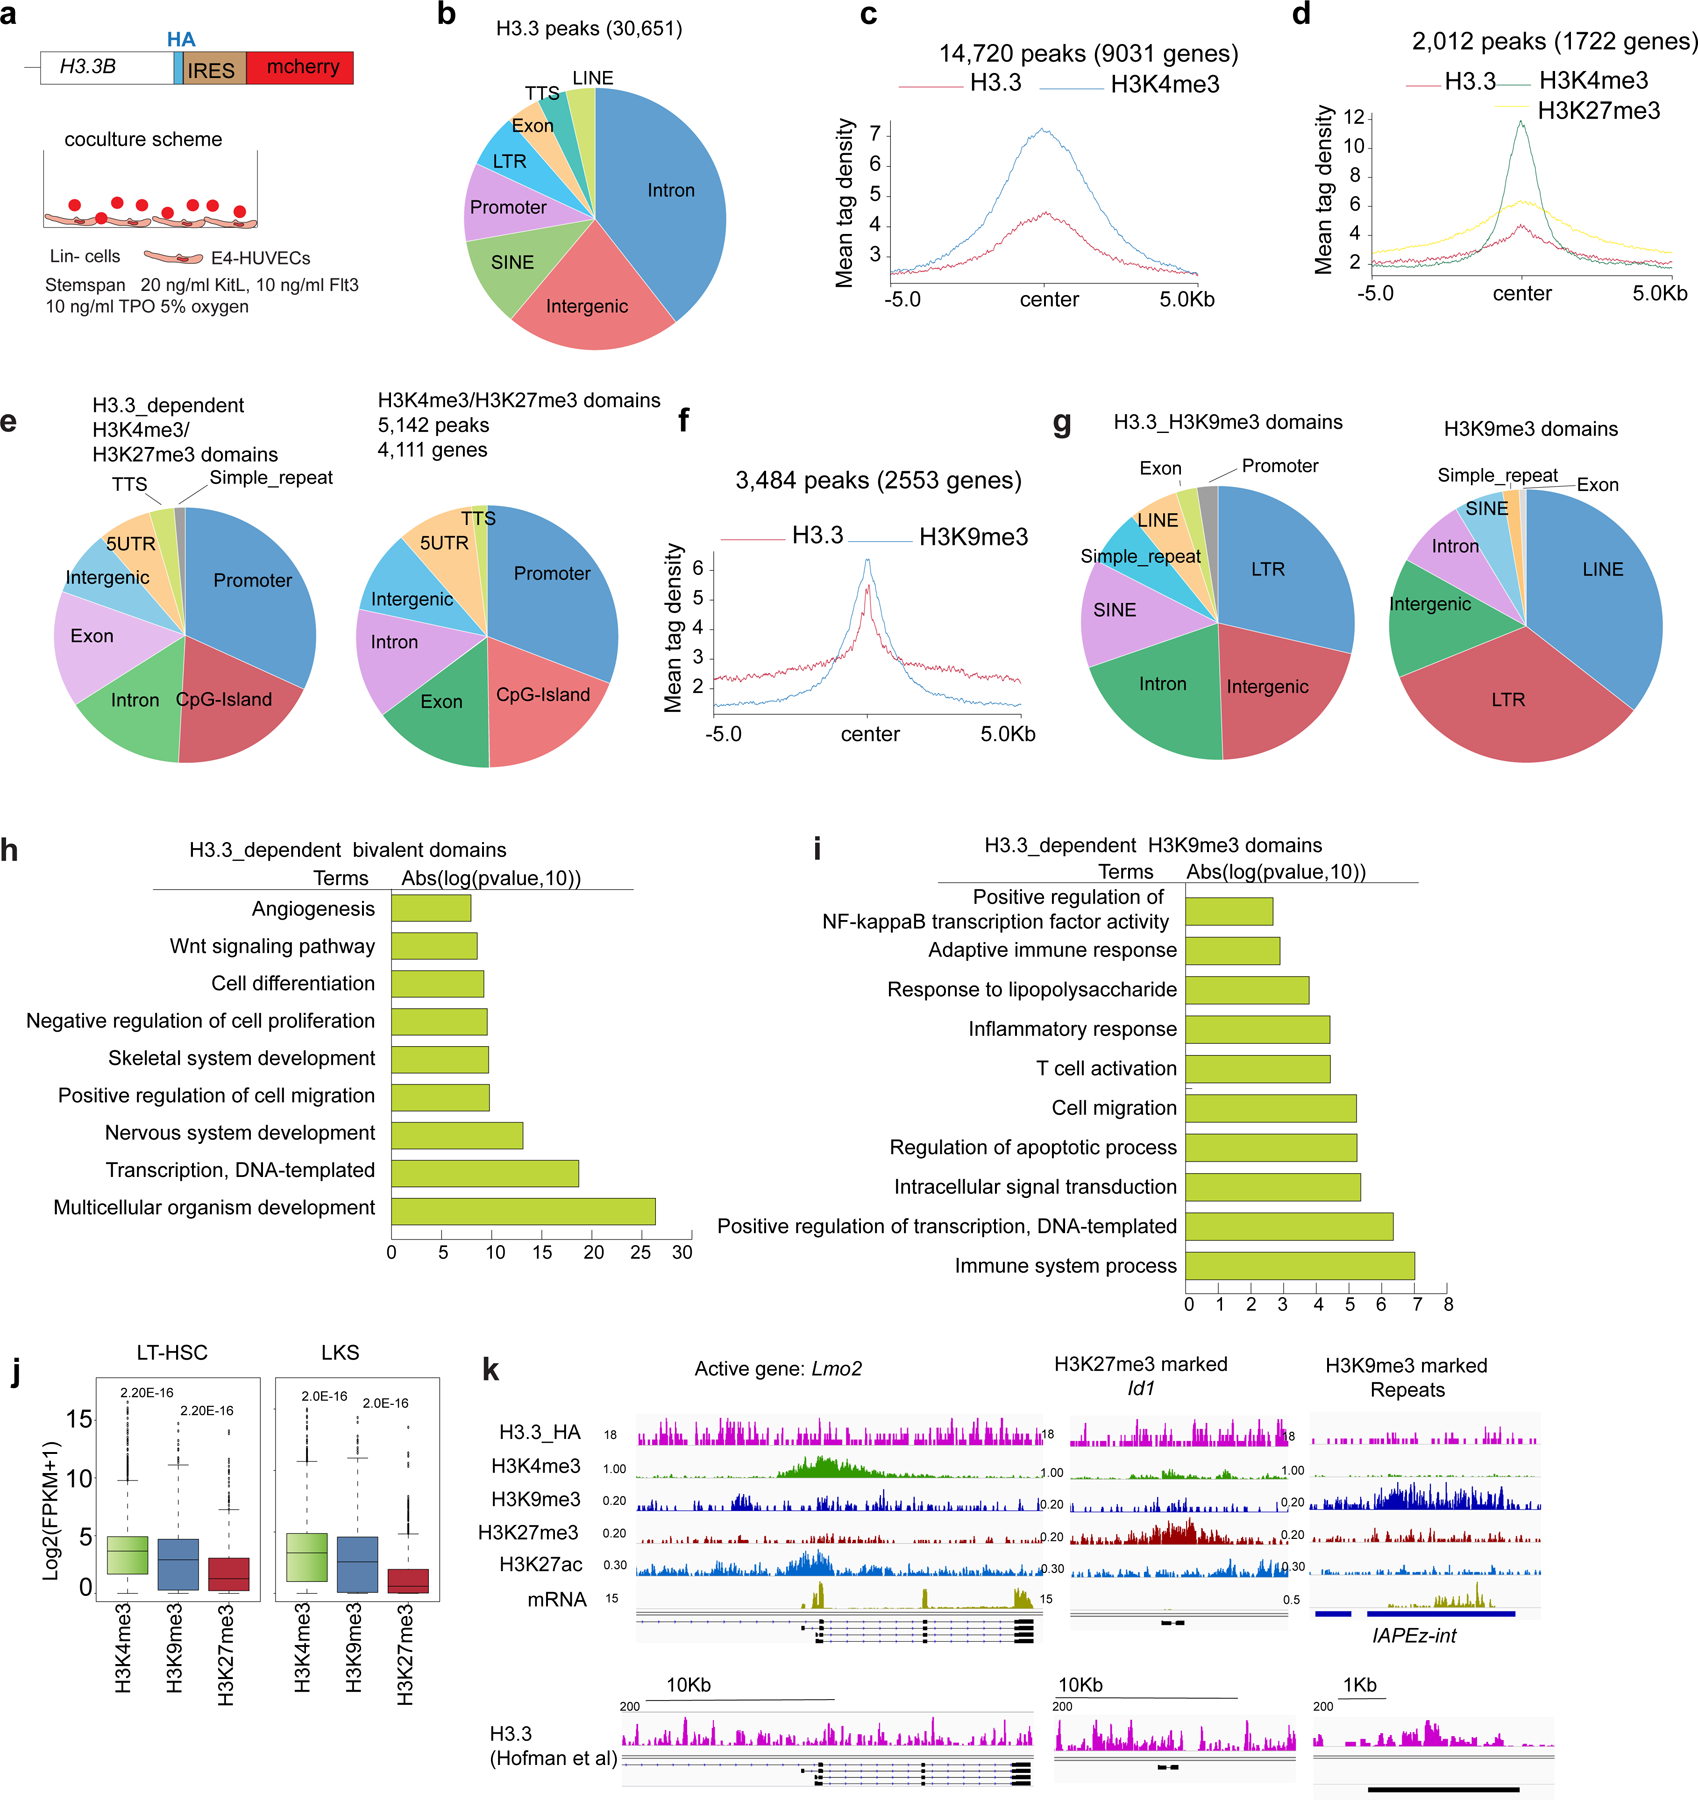
Extended Data Fig. 7 |. H3.3 enrichment colocalizes with active histone marks H3K4me3 and repressive histone mark H3K27me3 or H3K9me3 within HSPCs.

a. Schematic view of the H3.3B-HA-IRES-mcherry knockin mice22 used to map the H3.3 binding site within HSPCs. Lin− cells were co-cultured with E4-HUVECs for 1 week to expand LKS cells; ChIP-seq was performed using HA antibody. n=1 biological sample. b. Genome-wide distribution of 30,651 H3.3 peaks in LKS cells. Across the genome, there are 14,720 H3K4me3_H3.3 overlapped peaks (c), 2,012 H3.3 dependent H3K4me3/H3K27me3 bivalent peaks (d), and 3,484 H3K9me3_H3.3 overlapped peaks (f). e. The genome-wide localization of the H3.3 dependent H3K4me3/H3K27me3 regions. g. The genome-wide localization of the H3.3 dependent H3K9me3 marked regions. For panels c, d, e, f, ChIP-seq for histone modifications H3Km4e3, H3K9me3, H3K27me3 has been performed on n=3 biological samples. h. Genes at or near the H3.3-dependent H3K4me3/H3K27me3 bivalent regions. i. Genes at or near the H3.3 dependent H3K9me3 marked regions. j. There are a total of 9,031 genes with H3.3-dependent H3K4me3 enrichment, 2,533 genes with H3.3-dependent H3K9me3 enrichment, and 1,722 genes with H3.3-dependent H3K4me3/H3K27me3 enrichment. The expression levels of these three categories of genes are shown for both LT-HSCs and LKS cells. p-values were calculated using two-tailed t-test using one biological sample for each cell type. The experiment was repeated three times. The boundaries of box indicate the 25 and 75 percentiles, center indicate median number, whiskers indicate 1.5X interquartile range. k. Representative genome browser view of enrichment of H3.3, H3K4me3, H3K9me3, H3K27me3, H3K27ac and mRNA expression levels for active genes, bivalent genes and repetitive elements. Also shown here is the genome browser view of H3.3 enrichment using anti-H3.3 antibody, kindly shared by another group. P-value is labelled on the top of the box plot in panel j.
