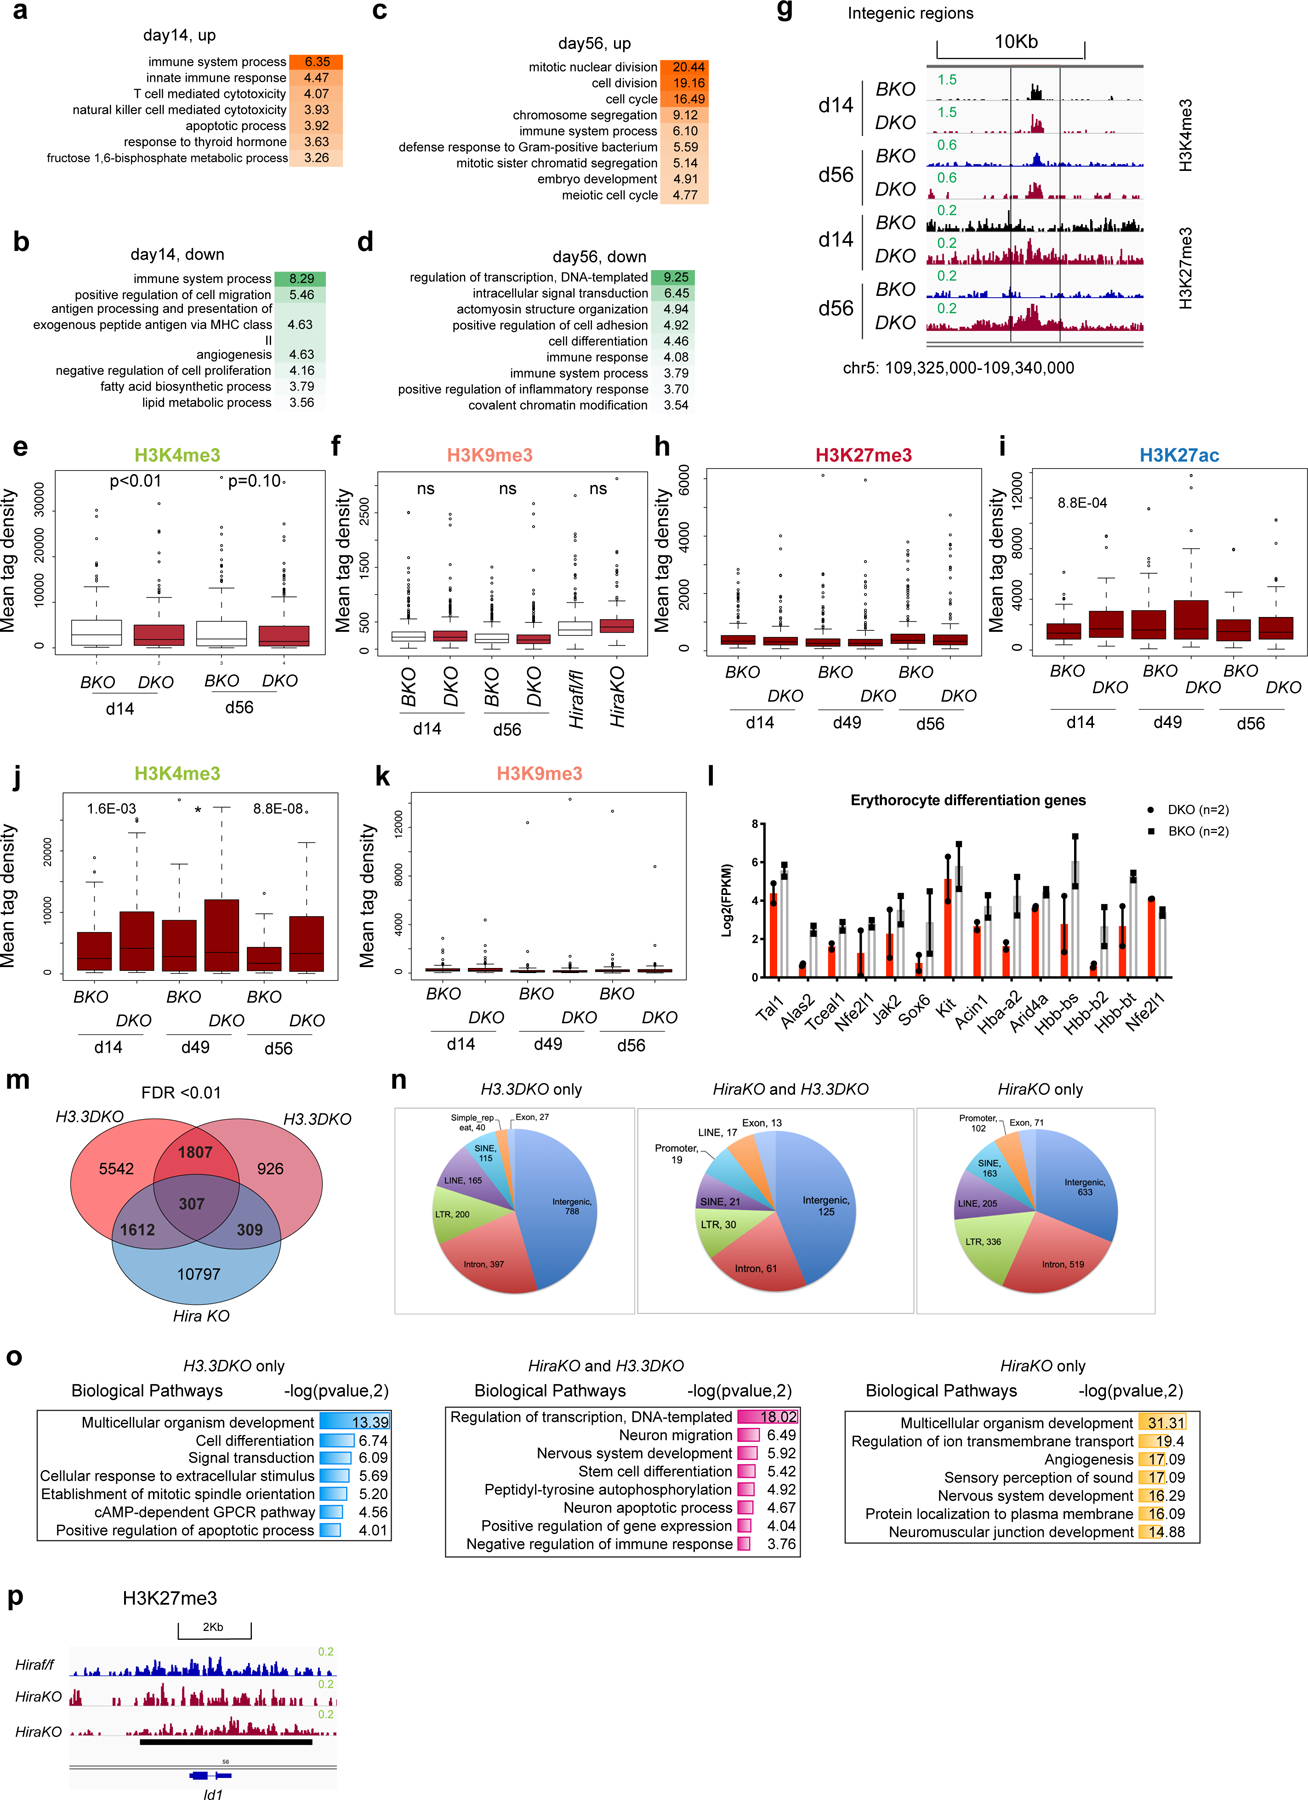
Extended Data Fig. 8 |. Dynamic changes of transcriptomic landscape within HSPCs following H3.3 deletion in vitro and in vivo.

a-b, DAVID gene ontology biological pathway of differentially expressed genes (DEGs) at day 14-post H3.3 deletion in DKO LKS cells, compared with BKO LKS cells (in vivo). c-d, DAVID gene ontology biological pathway analysis of DEGs at day 56 post H3.3 deletion in DKO LKS cells, compared with BKO LKS cells (in vivo). e-f, the mean tag density of H3K4me3 and H3K9me3 at the promoter regions of the 385 downregulated genes associated with PC1. P-values were calculated using unpaired two-tailed t-test using one biological sample of each genotype. The experiment was performed twice independently for d14, once for d49, d56, and once for Hirafl/fl and HiraKO. g. Representative genome browser view of H3K4me3 and H3K27me3 intensity at intergenic region, at day 14 and day 56 post H3.3A deletion. h-k. For the commonly upregulated genes at d14 and d56 (171 genes), the enrichment of histone modifications H3K27me3, H3K27ac, H3K4me3, and H3K9me3 at the promoter regions is shown. For panels h-k, P-values were calculated using unpaired two-tailed t-test using one biological sample of each genotype. The experiment was performed twice independently for d14, once for d49, d56, and once for Hirafl/fl and HiraKO. l. Downregulation of key genes involved in erythrocyte differentiation within DKO LKS cells, compared with BKO LKS cells (n=2 biological samples). m, Venn diagram showing the overlap between the H3K27me3-reduced peaks within H3.3DKO cells and HiraKO LKS cells. n. The genome-wide distribution of DKO only, HiraKO and H3.3DKO shared, and HiraKO only H3K27me3-reduced peaks. o. The genes nearby the H3K27me3_reduced peaks are enriched in distinct biological pathways, as shown in the table. p. The H3K27me3 enrichment around the promoter regions of Id1 gene in Hirafl/fl or HiraKO LKS cells. For 8l, error bar indicates standard error of the mean. For the box plots in panels e-f, h-k, the boundaries of box indicate the 25 and 75 percentiles, center indicate median number, whiskers indicate 1.5X interquartile range. For e,-f, h-k, and o, p-values were calculated using two-tailed t-test. P-value is indicated on top of the box plot in panels e and f.
