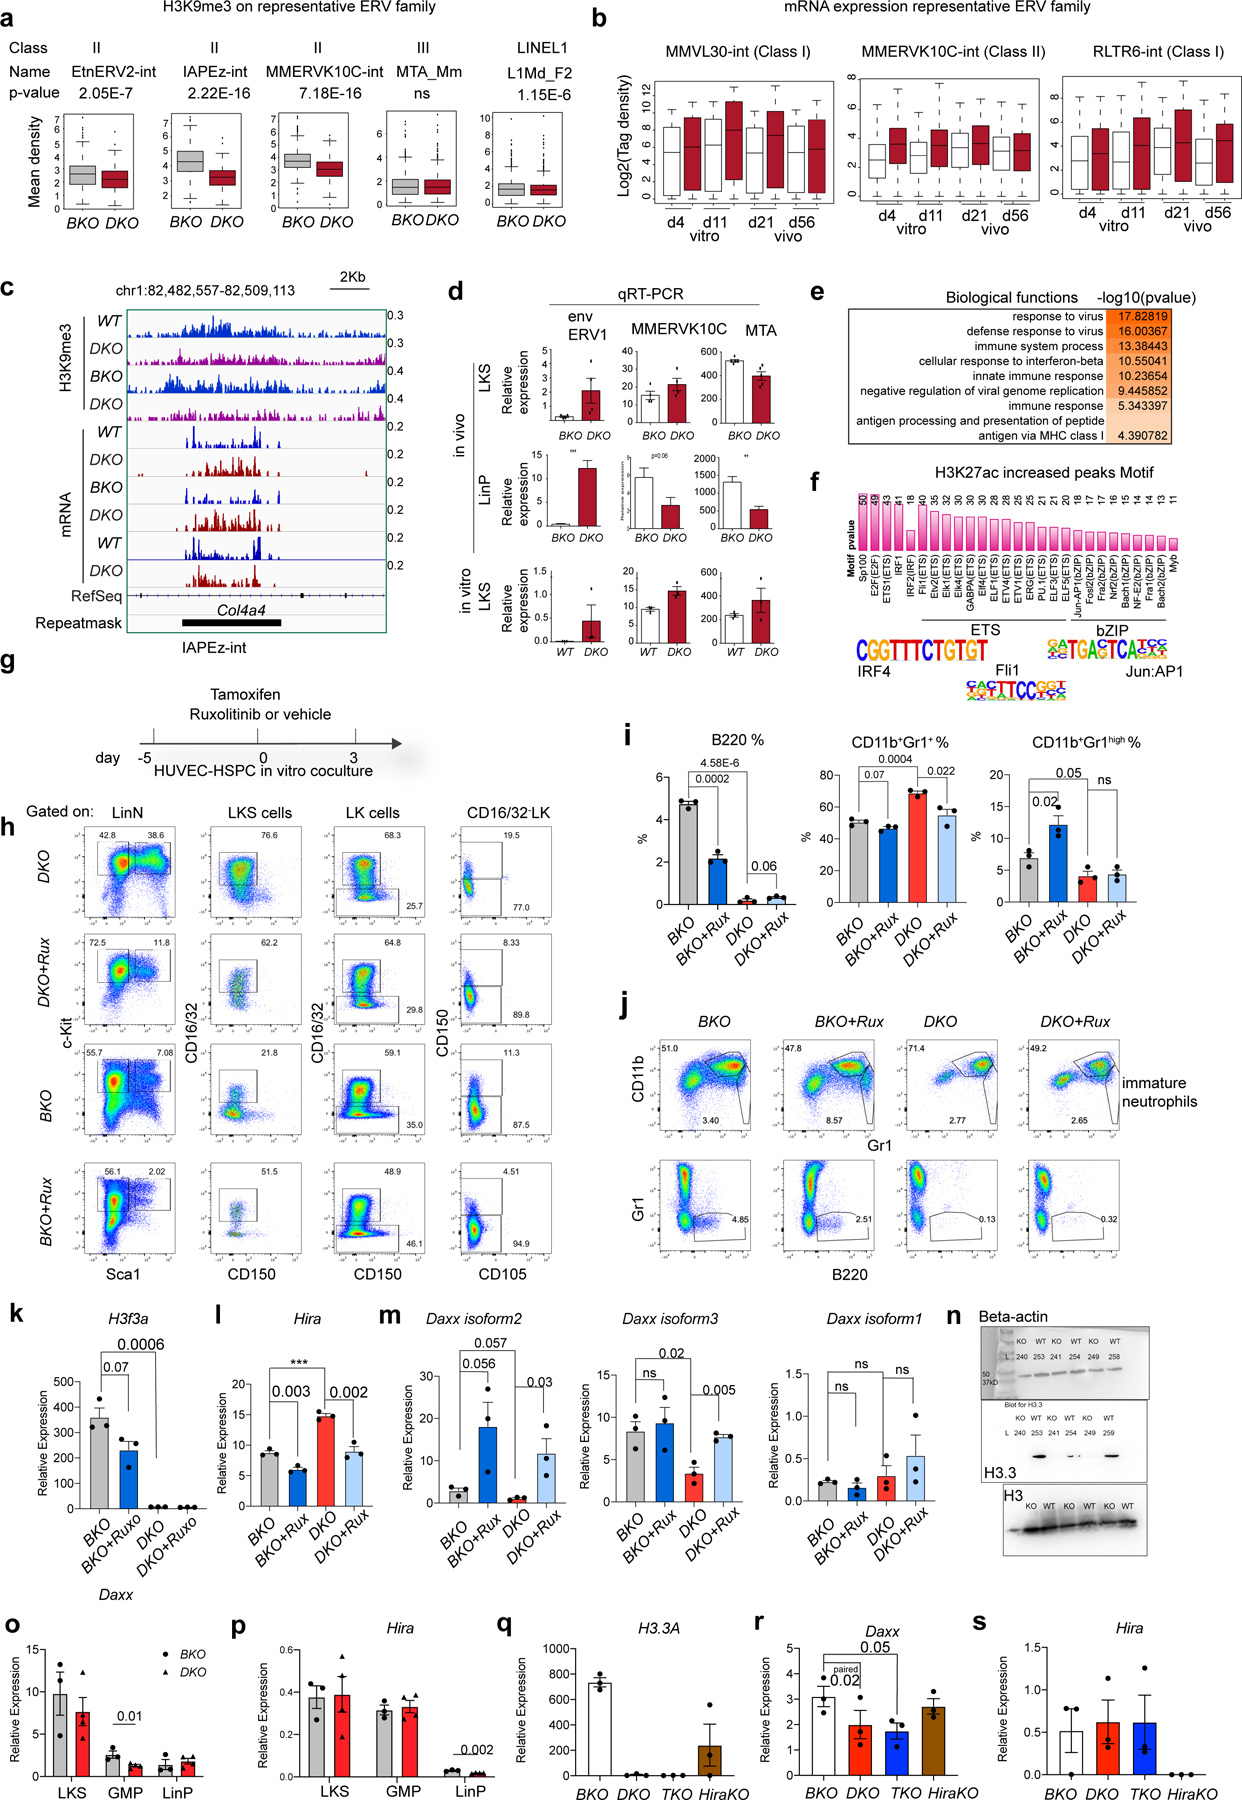
Extended Data Fig. 9 |. Dysregulated ERV expressions in H3.3DKO LKS cells triggered interferon responses, responsible for the myeloid bias.

a. H3K9me3 enrichment at representative ERV family. p-value was calculated using unpaired two-tailed t-test using one biological sample for each genotype. The experiment was repeated twice independently. b. The dynamic changes of ERV mRNA expression at in vitro or in vivo settings with DKO and BKO LKS cells (n=1 biological sample for each column). For the box plots in a, b, the boundaries of box indicate the 25 and 75 percentiles, center indicate median number, whiskers indicate 1.5X interquartile range. c. Genome browser plots showing the reduction of H3K9me3 and increased mRNA expression at a IAPEz-int ERV region. d. qRT-PCR quantifications of ERV expression at in vivo or in vitro LKS cells. env encodes for the envelope protein of ERV1. The number of dots indicate the number of biological samples]. e. At day 4 after in vitro deletion of H3.3A gene, the biological pathways associated with upregulated DEGs. f. We performed ChIP-seq for H3K27ac, an enhancer mark. The motifs within the H3K27ac increased regions include interferon pathway downstream transcription factor, Irf. g. The experimental scheme to test the effect of Jak2 inhibitor Ruxolitinib on the expansion and differentiation of HSPCs. h. Representative flow cytometric plots for the LKS, CD16/32+ LKS cells, pre-MegE, and pre-GM populations within the cocultures. i. The percentages of lineage positive cells within the total cultured cells. CD11b+Gr1+, immature neutrophils; CD11b+Gr1high, mature neutrophils. j. Representative flow cytometric plots for the lineage cells within the cocultures. k-m, at in vitro cultures, the mRNA expression of H3.3A, Hira, and Daxx within LKS cells. n-o, Daxx or Hira mRNA expression within LKS cells, GMPs, and LinP cells at in vivo scenarios. p-r, another batch of in vivo experiments, the mRNA expression of H3.3A, Hira, and Daxx within LKS cells was quantified. For panels I, k-m, o-s, the number of dots indicate the number of independent biological samples. Error bars indicate SEM. p-value is calculated using unpaired, two-tailed t-test unless otherwise indicated on the plot. P-value for panel a is labelled in the legend; p-value for panel b is not shown. Numerical source data are provided in Source Data.
