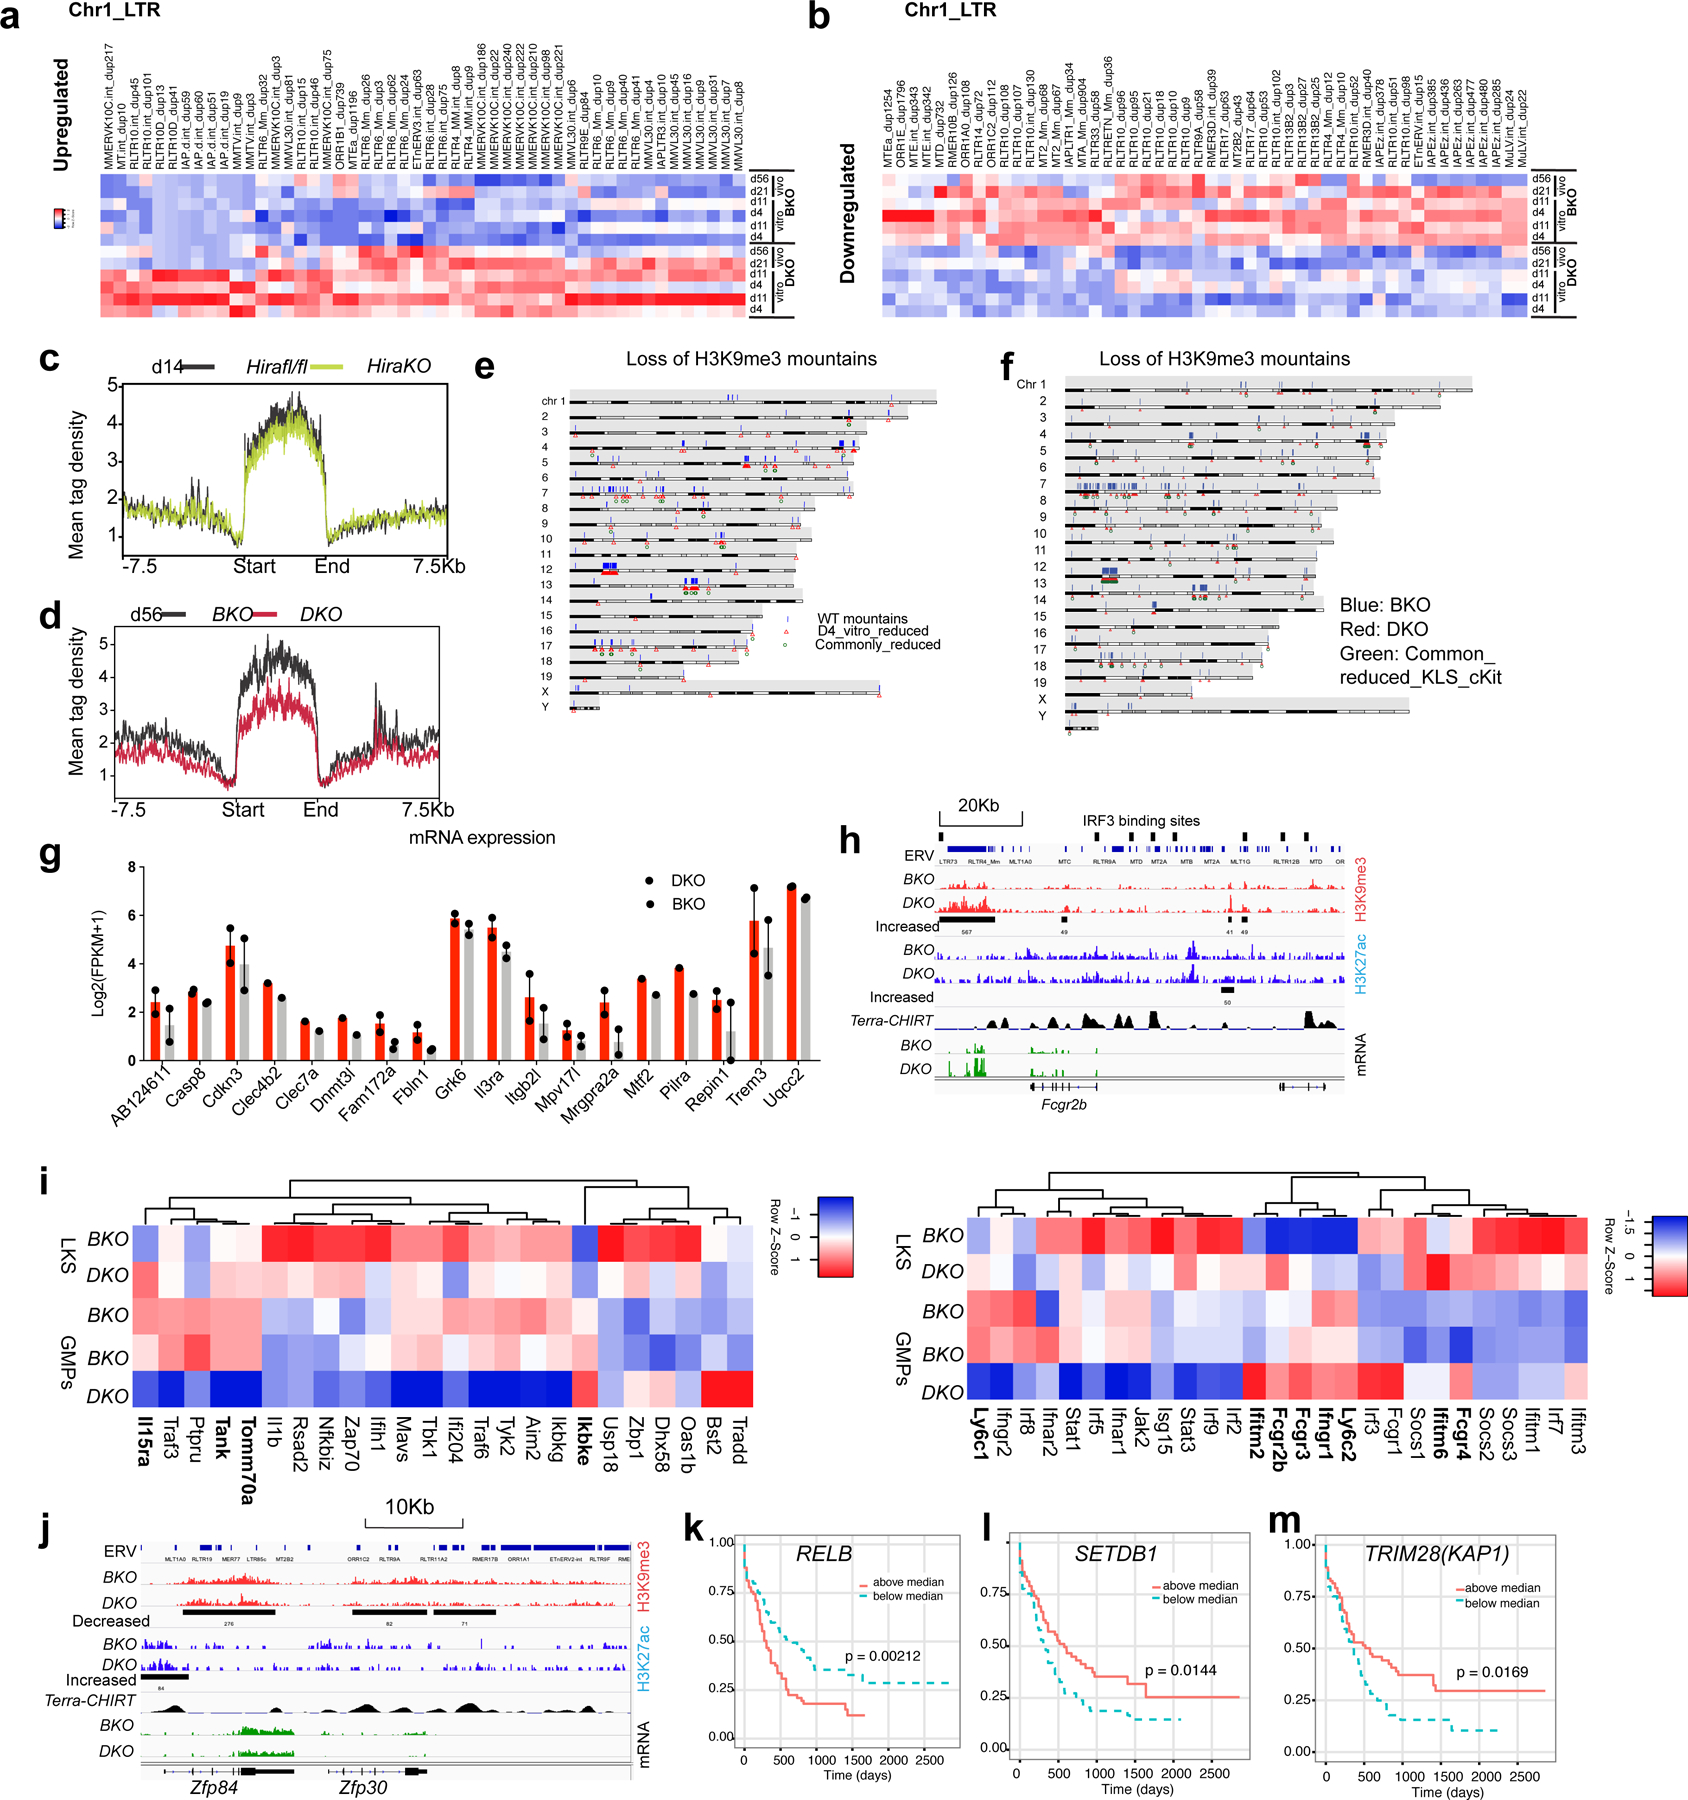
Extended Data Fig. 10 |. Reduction of H3K9me3 opens up the accessibility of transcription factor binding sites.

a. Heatmap showing the increased ERV RNA expression within DKO LKS cells, compared with BKO LKS cells in chromosome 1. b. Heatmap showing the decreased ERV RNA expression within DKO cells, compared with BKO LKS cells. c. There is no H3K9me3 reduction mountain in HiraKO LKS cells. d. The H3K9me3 mountain in DKO cells persist into later stage d56 after H3.3A deletion. e. Karyotype plot showing the localization of H3K9me3 mountain in BKO LKS cells (blue bars), reduced H3K9me3 mountain in D4 DKO LKS cells (in vitro) (red triangle), and commonly reduced H3K9me3 mountains within three biological replicates. f. Karyotype plot showing the localization of H3K9me3 mountain in BKO LKS cells (blue bars), reduced H3K9me3 mountain in DKO LKS cells (red triangle), and commonly reduced H3K9me3 mountains within LKS and LK cells. g. The increased mRNA expression near decreased H3K9me3 peaks (distance from TSS < 10Kb) (n=2 biological samples). h. GMP marker Fcgr2b mRNA is upregulated in DKO HSPCs. Near Fcgr2b gene, there is increased H3K9me3 enrichment at ERV site, putative IRF binding site and Terra binding site67. i. Heatmap showing the expression of interferon target genes in BKO or DKO LKS cells, BKO or DKO GMPs. The gene with increased mRNA expression in DKO LKS cells compared with BKO LKS cells were labelled in bold. j, example of reduced mRNA expression near the H3K9me3_reduced_ERV regions. k-m. Kaplan Meyer survival curve for acute myeloid leukaemia patients striated according to the mRNA expression level of RELB (k), SETDB1 (k), and TRIM28 (l)54. For k and m, p-values were calculated using log-rank test. Error bars represent SEM. Numerical source data and unprocessed blots are provided in Source Data.
