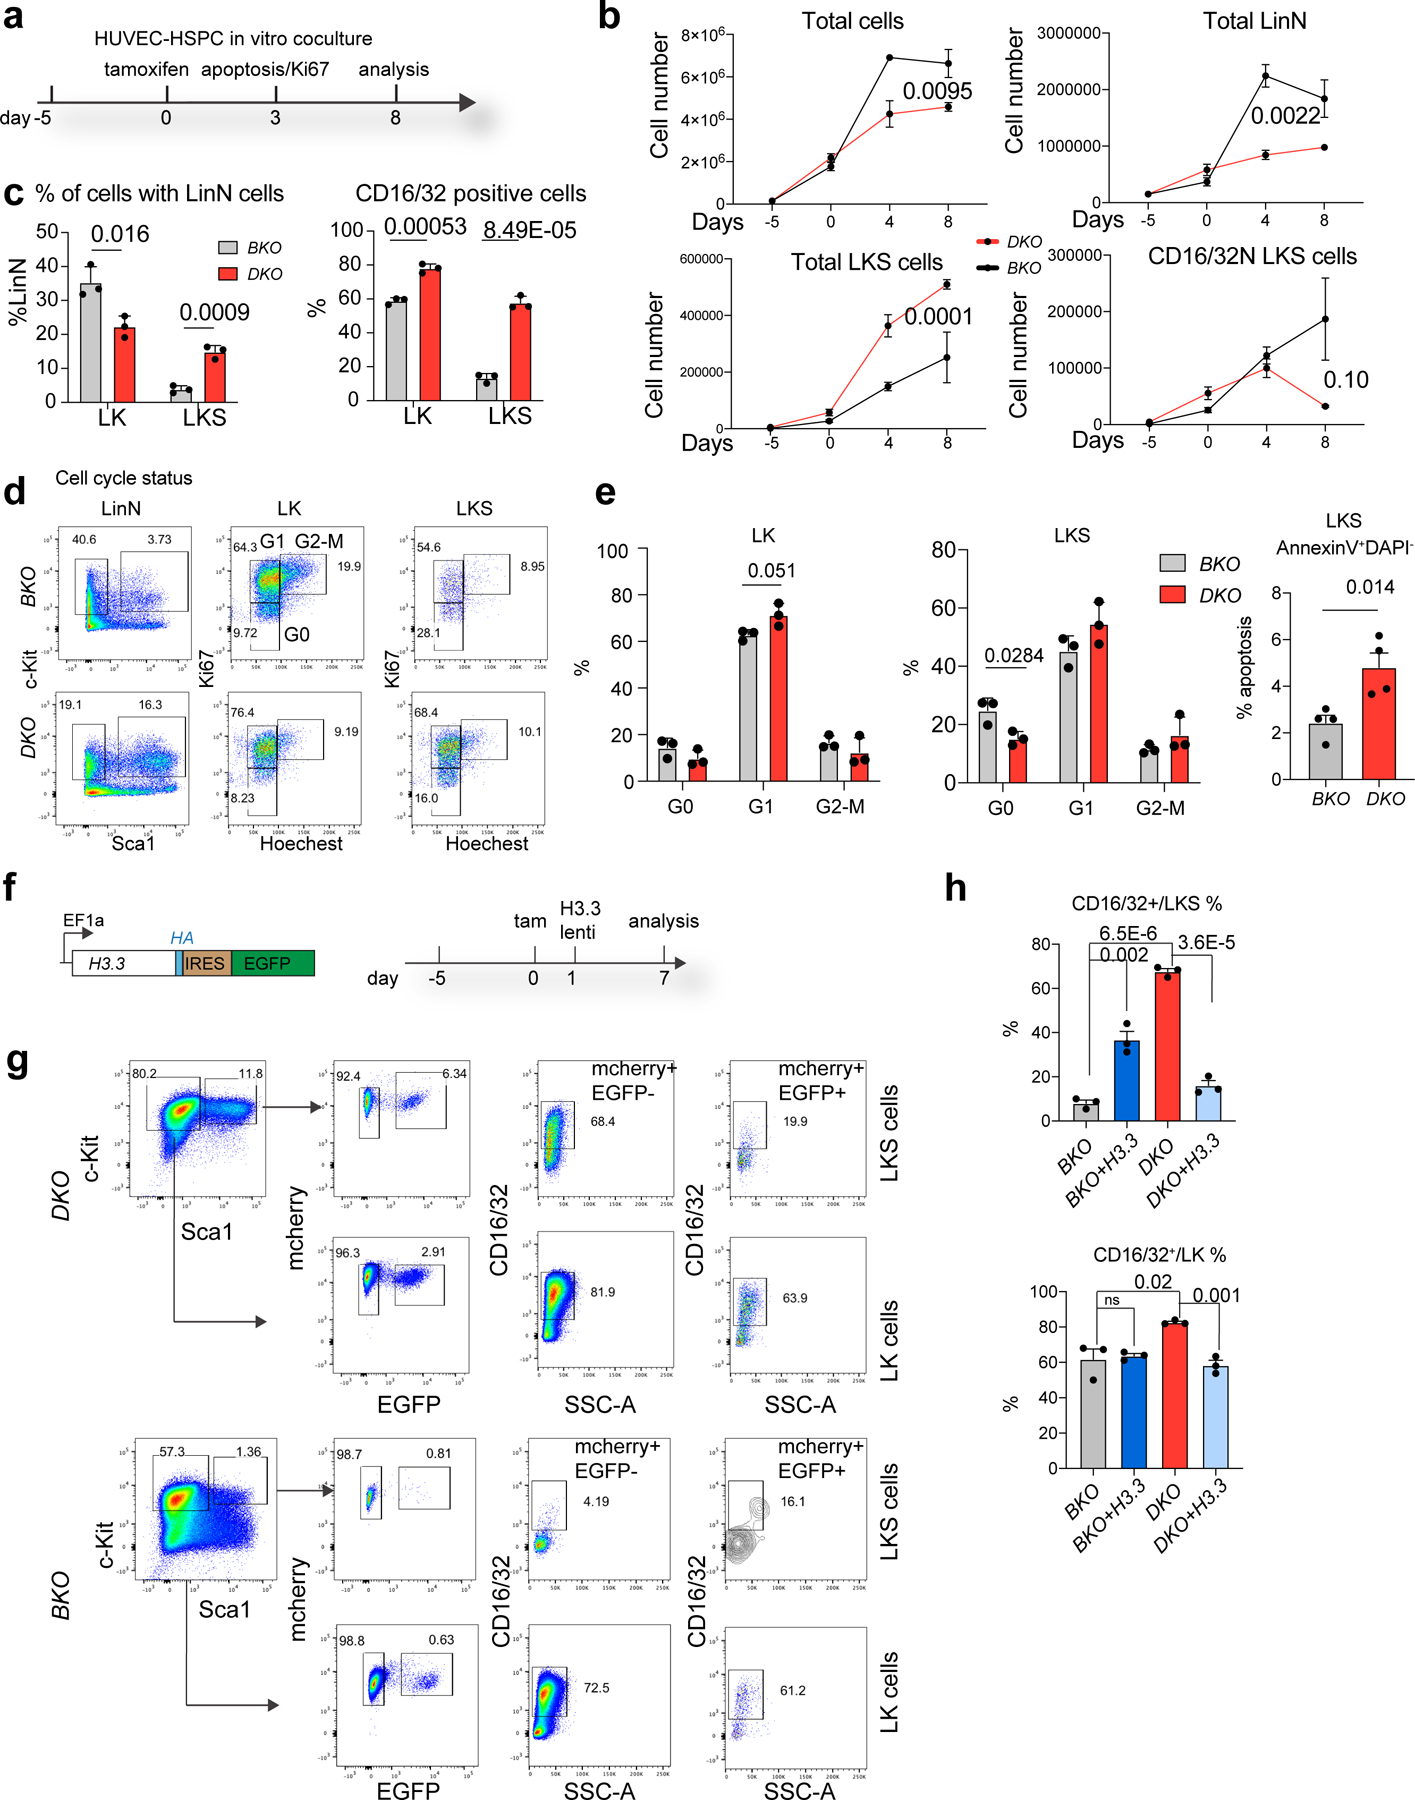
Fig. 2 |. H3.3 maintains HSC quiescence and blocks myeloid differentiation.

a, Schematic view of the in vitro HUVEC–HSPC co-culture experiment. The cell-cycle and apoptosis status of the cells was evaluated 3 d after tamoxifen treatment; the total number of LKS and lineage cells were quantified 8 d after the tamoxifen (Tam) treatment. b, Total number of haematopoietic, LinN, LKS and CD16/32− LKS cells at different time points during the co-culture. c, Percentages of LK and LKS cells in the LinN cell populations (left). Percentages of CD16/32+ LK and LKS cells at day 7 post tamoxifen treatment (right). d, Representative flow cytometry plots for the analysis of the cell-cycle status of LK and LKS cells on day 3 after H3.3A deletion. e, Percentages of cells in different stages of the cell cycle (LK, left; LKS, right) and the percentage of LKS cells in apoptosis. f, We carried out a rescue experiment using lentiviral-mediated overexpression of H3.3. The lentiviral construct (left) and the experimental scheme (right) are shown. Due to the limited transduction efficiency of lentivirus into LKS cells, we used H3.3BmCherry/mCherry BKO or Rosa26cre+H3.3Afl/flH3.3BmCherry/mCherry DKO cells. g, Representative flow cytometry plots for the LK and LKS cells following H3.3 overexpression. Overexpression of H3.3 (mCherry+EYFP+ cells) has reduced expression of the CD16/32+ marker in both LKS and LK DKO cells (top). Overexpression of H3.3 increased the expression of CD16/32+ in LKS BKO cells (bottom). d,g, The percentage of cells in the boxed regions in the flow cytometry plots are indicated. h, Percentages of CD16/32+ BKO, BKO + H3.3, DKO and DKO + H3.3 LKS (top) and LK (bottom) cells. Error bars represent the s.e.m.; n = 3 independent biological samples for all panels, except the apoptosis assay in e, where n = 4. The P values were calculated using an unpaired two-tailed Student’s t-test (c,e,h), two-way ANOVA (b, total, LinN and LKS cells) or a two-tailed Student’s t-test (b, CD16/32− LKS cells on day 8) and are indicated on the graphs; NS, not significant. Numerical source data are provided.
