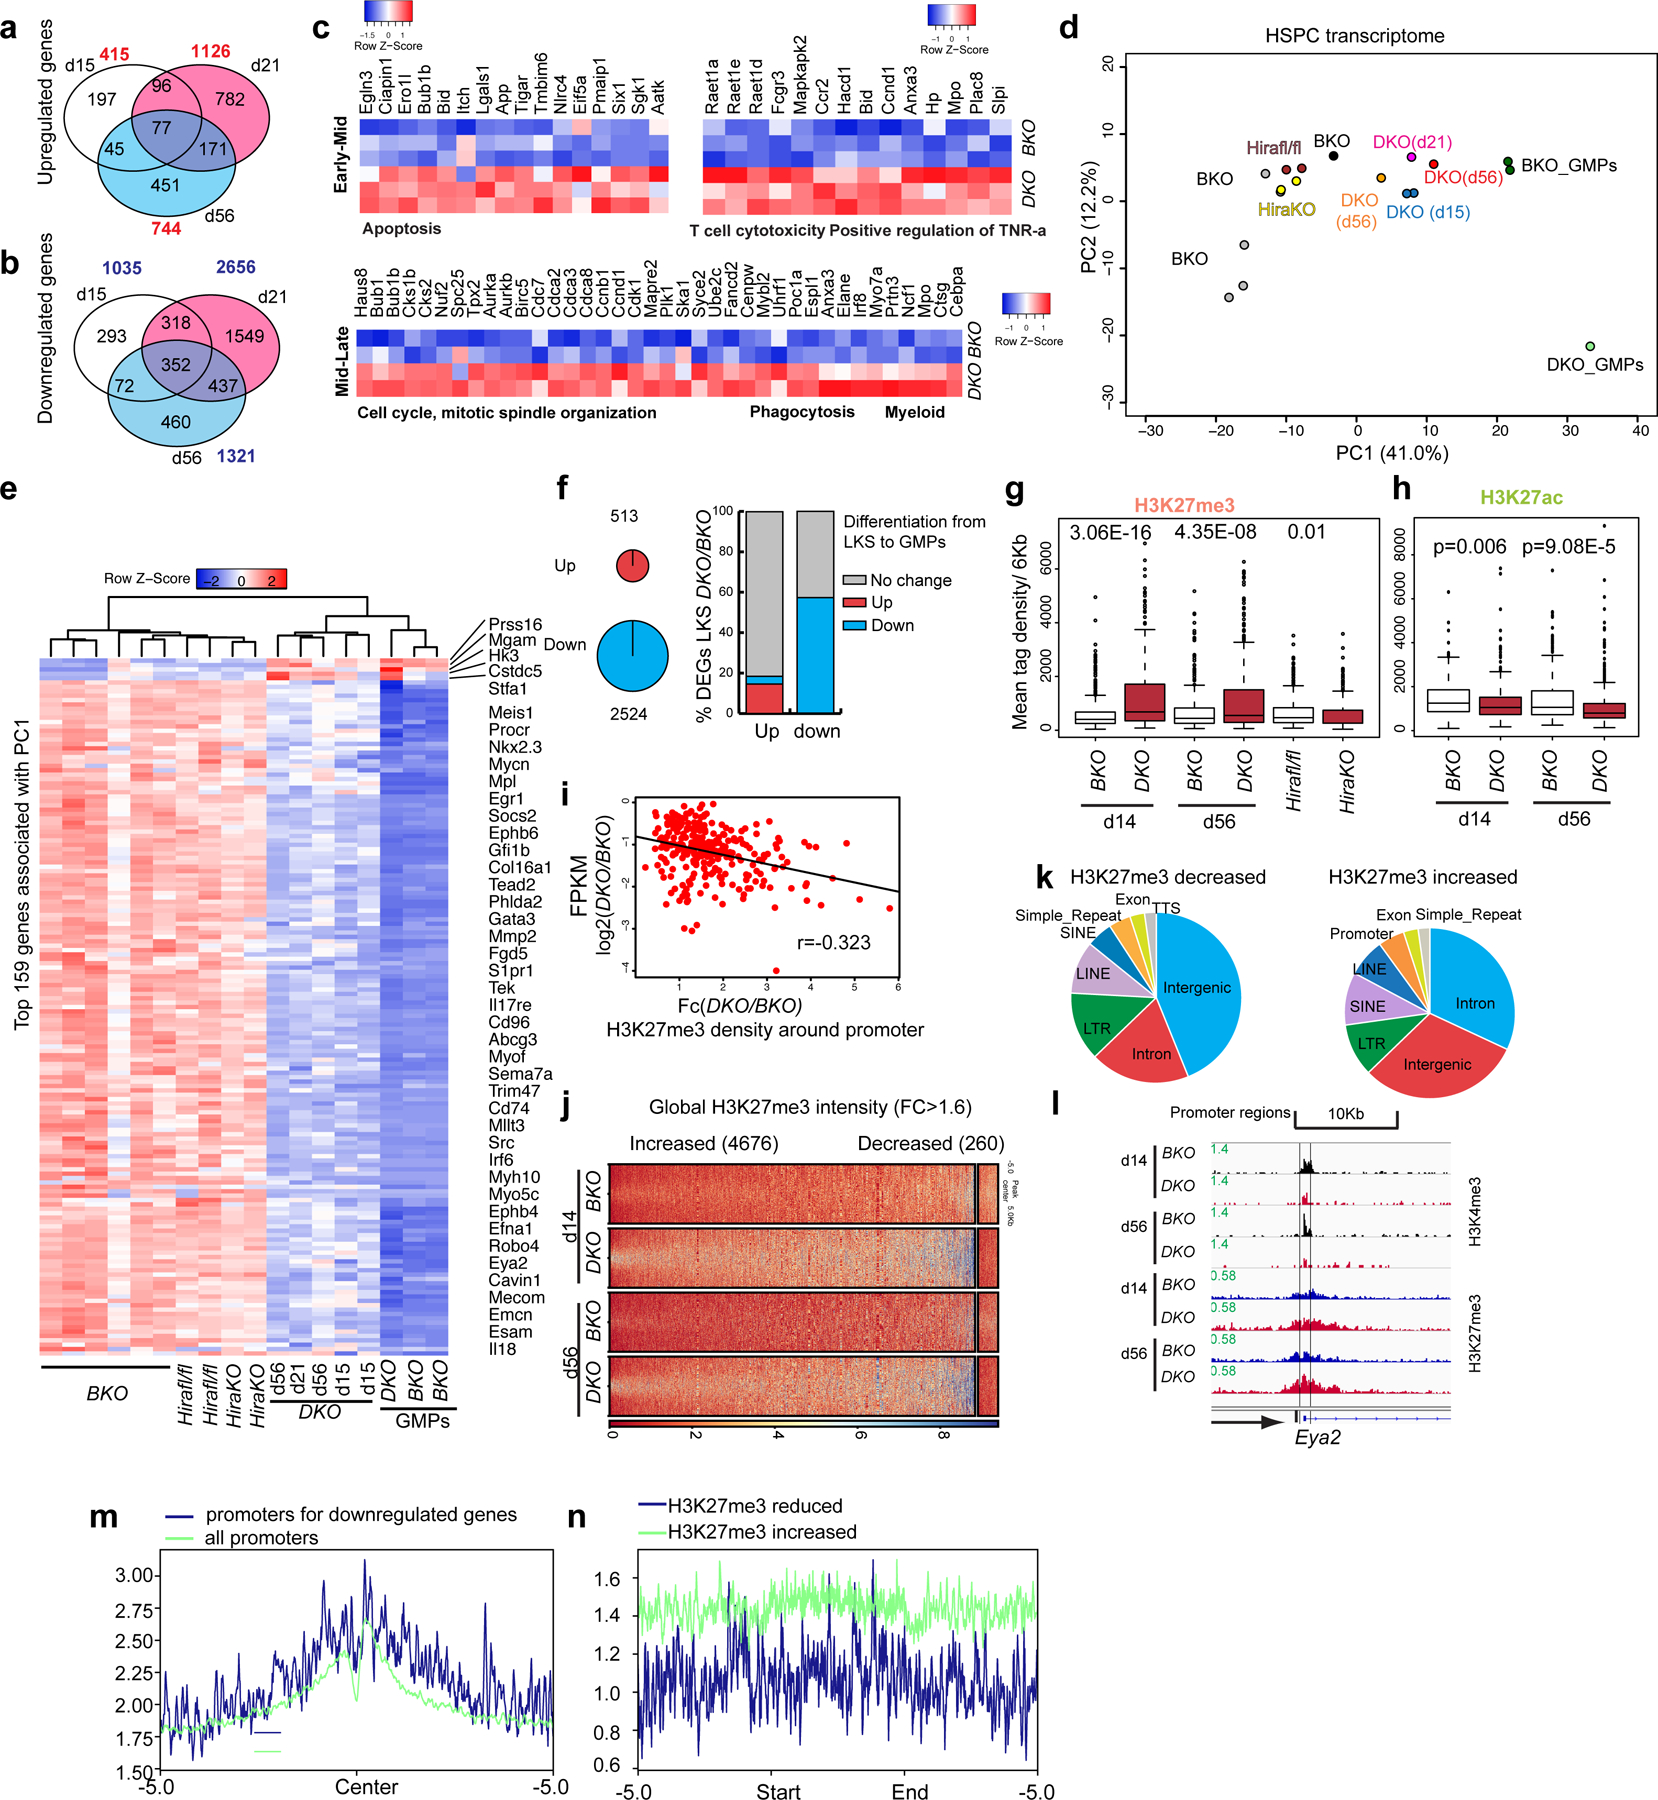
Fig. 3 |. H3.3-null HSPCs demonstrated a GMP-like transcriptomic signature and a predominant gain of H3K27me3 marks.

a,b, Number of upregulated (a) and downregulated (b) DEGs on days 15, 21 and 56 after H3.3A deletion (P < 0.05; FC > 1.8). The P values were calculated using a two-tailed Student’s t-test. The total numbers of genes that are upregulated or downregulated at the different time points are shown in red (a) and blue (b), respectively. c, We arbitrarily divided the time following H3.3 deletion into early–mid and mid–late stages. The early–mid DEGs are enriched for apoptosis, T-cell cytotoxicity and positive regulation of TNF-ɑ. The mid–late stage DEGs are enriched for the cell-cycle, mitotic-spindle organization, phagocytosis and myeloid cell biological pathways. d, HSPC transcriptome. Principal component (PC) analysis of FPKM values in different samples, using the most variably expressed genes including the DEGs at early (n = 1,450) and late (n = 329) time points after H3.3 deletion, and the DEGs between Hirafl/fl and Hira-KO HSPCs (n = 313). e, Heatmap showing the expression of the top 159 genes associated with PC1 in LKS cells from BKO, Hirafl/fl, Hira-KO and DKO mice as well as GMPs from BKO and DKO mice. Among the top 159 genes associated with PC1, five are increased in DKO LKS cells; the remaining 154 genes are downregulated. f, In the differentiation of LKS cells towards GMPs, there are 513 and 2,524 genes that are significantly upregulated and downregulated, respectively (left). Percentage of overlap between the up- and downregulated genes in DKO cells relative to BKO cells (y axis) and the up and downregulated genes from LKS-to-GMP differentiation (x axis; right). g, Levels of H3K27me3 enrichment at the promoter regions (TSS ± 3 kb) of the top 385 downregulated genes associated with PC1. The experiment was repeated twice independently for the BKO and DKO cells at each time point; the experiment was performed once for the Hirafl/fl and Hira-KO cells. h, H3K27ac profiles at the promoter regions of the top 385 downregulated genes associated with PC1. The experiment was repeated twice independently for each column. g,h, The P values were calculated using an unpaired two-tailed Student’s t-test using one biological sample for each genotype and are indicated on the graphs. In the box-and-whisker plots, the boundaries of the box indicate the 25th and 75th percentiles, the centre line indicates the median and the whiskers (dashed lines) indicate 1.5× the interquartile range. i, Correlation between the mRNA level changes of the 385 downregulated genes (FPKM) and the density of H3K27me3 around the promoter (DKO/BKO FC); r, coefficient of multiple correlation. j, Globally, a larger number of regions had increased H3K27me3-peak intensity than decreased H3K27me3-peak intensity in DKO LKS cells compared with BKO LKS cells. k, Genome-wide distribution of the H3K27me3-decreased (left) and H3K27me3-increased (right) peaks. l, Representative genome browser track showing the reduced H3K4me3 and increased H3K27me3 at the Eya2 promoter locus on days 14 and 56 after H3.3 deletion in vivo. m, H3.3 enrichment at the 385 downregulated genes associated with PC1 compared with all promoters. n, H3.3 enrichment at the H3K27me3-reduced regions and H3K27me3-increased regions. There is more H3.3 enrichment at the H3K27me3-increased regions compared with the H3K27me3-reduced regions.
