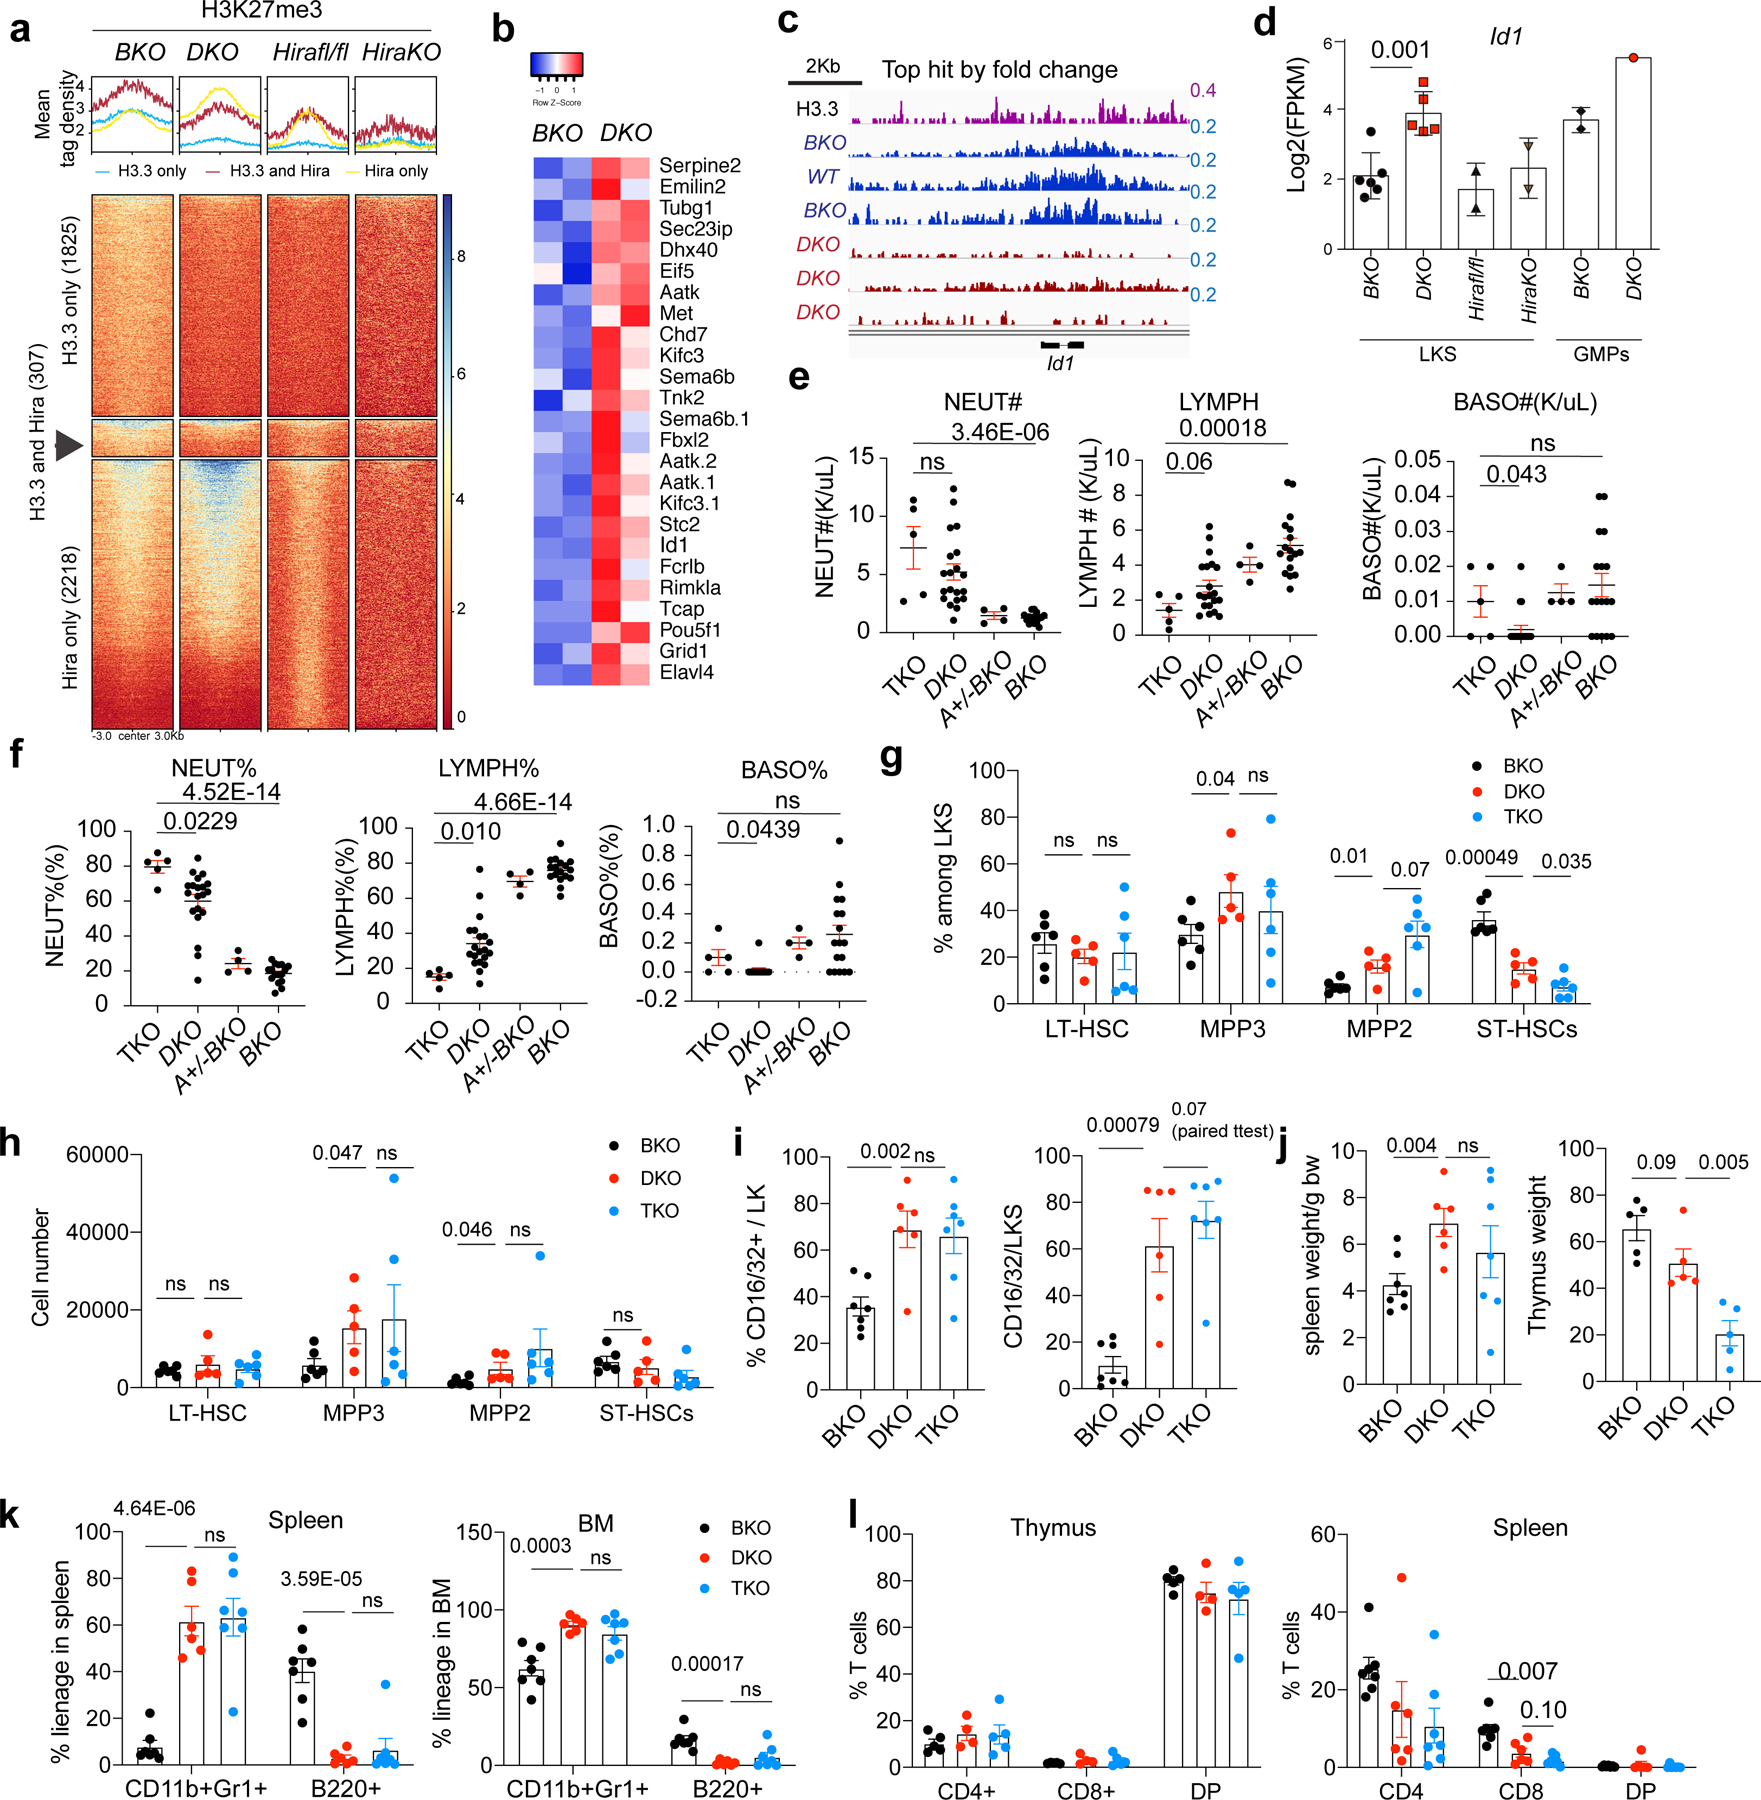
Fig. 4 |. Id1 deletion does not rescue the increased myelopoiesis in DKO mice.

a, Histograms (top) and heatmap (bottom) showing the H3K27me3 mean tag density at H3K27me3-reduced regions in BKO, DKO, Hirafl/fl and Hira-KO LKS cells. The heatmap shows the H3K27me3-reduced regions for the DKO only, DKO and Hira-KO shared and Hira-KO only cells. b, FPKM levels of genes with concomitant promoter-region H3K27me3 reduction and increased mRNA expression levels in DKO HSPCs. Aatk.1 and Aatk.2 are two isoforms of Aatk. c, The gene with the highest H3K27me3 reduction, ranked according to the FC, is Id1. d, Expression levels of Id1 mRNA in BKO, DKO, Hirafl/fl and Hira-KO LKS cells as well as BKO and DKO GMPs. e,f, We crossed DKO mice with Id1-mutant mice35 and generated Rosa26creERT2+H3.3Afl/flH3.3B−/−Id1−/− mice. After tamoxifen-induced H3.3A deletion, the resulting mice were termed TKO mice. The total number (e) and percentages (f) of neutrophils, lymphocytes and basophils in the peripheral blood of the indicated mice were determined. g,h, Percentage (g) and total number (h) of LT-HSCs, ST-HSCs, and MPP3 and MPP2 cells in BKO, DKO and TKO mice. i, Percentage of GMPs in the LK cell populations (left) and of CD16/32+ cells in the LKS cell populations (right). j, Spleen and thymus weight (normalized to the body weight of the mouse) for the BKO, DKO and TKO mice. k, Percentage of lineage cells in the spleen (left) and BM (right) of the TKO mice. l, Percentage of T cells in the thymus (left) and spleen (right) of the TKO mice. DP, CD4+CD8+ double-positive cells, k,l, Each dot represents an individual mouse. Error bars represent the s.e.m. P values were calculated using an unpaired two-tailed Student’s t-test, except for the panel in Fig. 4i (P = 0.07), and are indicated on the graphs. NS, not significant. Numerical source data are provided.
