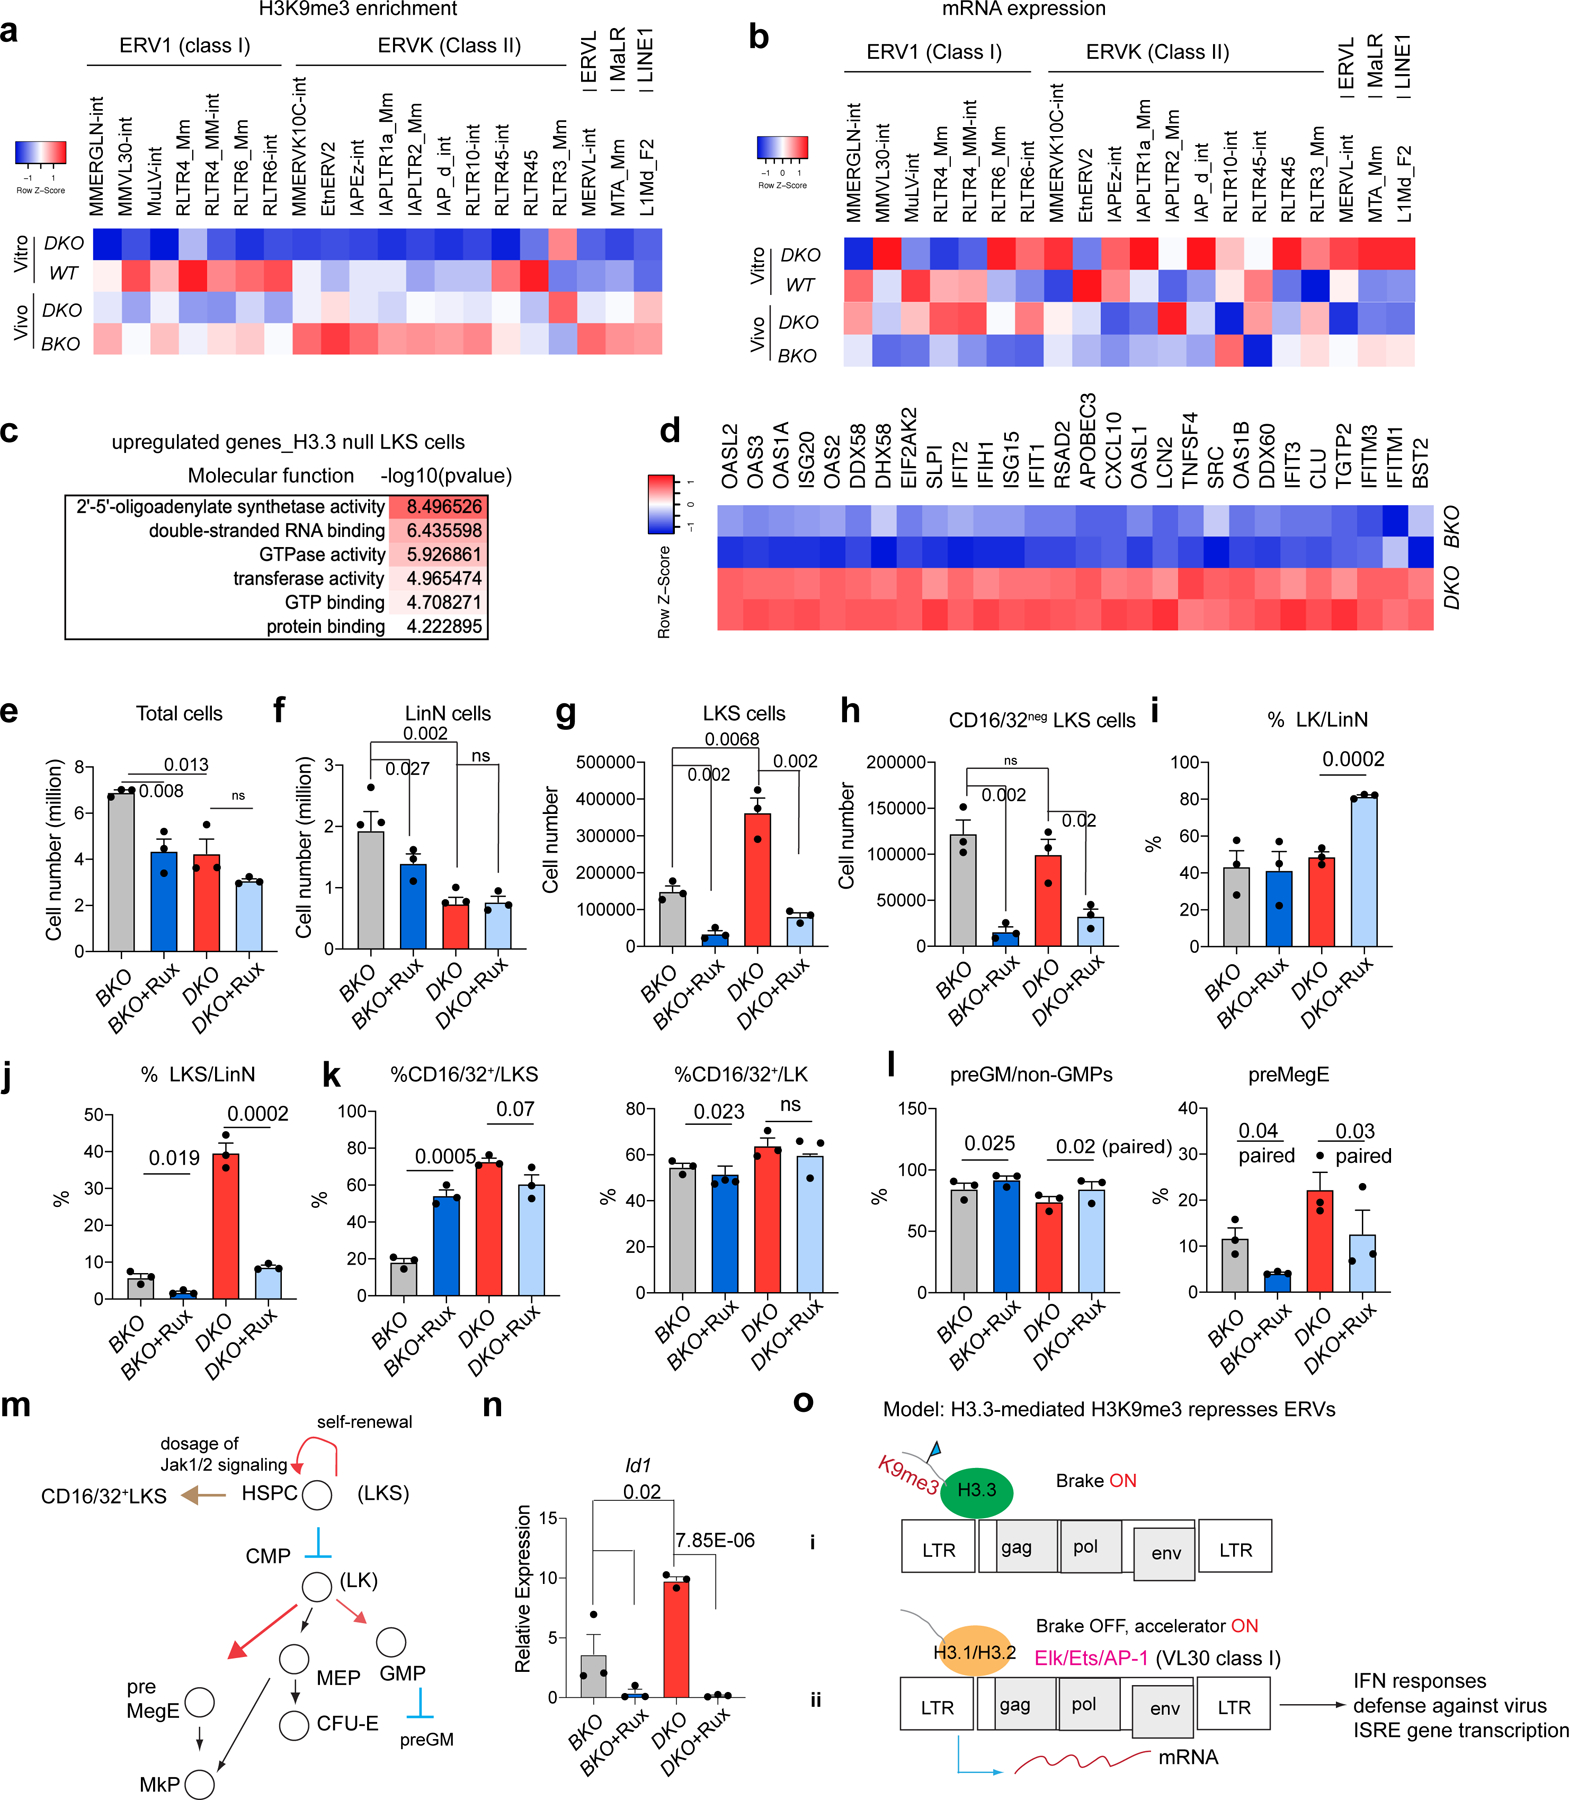
Fig. 5 |. Reduction of H3K9me3 and dysregulated ERV expression in DKO HSPCs.

a, Heatmap showing the levels of H3K9me3 enrichment at representative ERV repfamilies in wild-type and DKO LKS cells (in vitro), and BKO and DKO LKS cells (in vivo). b, Levels of mRNA expression of representative ERV repfamilies. c, Molecular functions associated with upregulated DEGs in H3.3-null LKS cells. d, Levels of RNA expression of genes involved in the cellular response to interferon-β. e, Total number of BKO and DKO LKS cells following treatment with Rux or vehicle. f,g, Total number of LinN (f) and LKS (g) cells in the BKO and DKO cells following treatment with Rux or vehicle. h, Total number of CD16/32− LKS cells for the indicated treatment groups. i,j, Percentage of LK (i) and LKS (j) cells in the LinN cell populations during the co-culture. k, Percentage of CD16/32+ cells in the LK (right) and LKS (left) cell populations. l, Percentages of progenitors to granulocytes and macrophages (preGM; left) and pre-megakaryocyte-erythrocyte progenitors (preMegE; right) subpopulations in the CD16/32− LK (non-GMPs) cells. m, Cartoon showing the regulation of HSC proliferation and differentiation by Jak1–Jak2 signalling. MEP, megakaryocyte erythroid progenitor. n, Expression levels of Id1 in LKS cells for the indicated treatment groups. o, Working model. The expression of ERV is regulated by a ‘brake and accelerator’ mechanism. H3.3-mediated H3K9me3 deposition serves as a repressive histone modification brake (i); when H3.3 is deleted, the brake is released (ii). The expression levels of ERV mRNA also depend on the signalling context. The ERV families with the binding sites for Elk/Ets/AP1 are expressed at higher levels in the presence of Elk/Ets/AP1, similar to RLTR6-int. e–l,n, Each dot indicates an independent biological sample. The error bars indicate the s.e.m. The P values were calculated using an unpaired two-tailed Student’s t-test, except for the two of the panels in Fig. 5l (P = 0.02 and 0.03), and have been indicated on the graphs. NS, not significant; WT, wild type. Numerical source data are provided.
