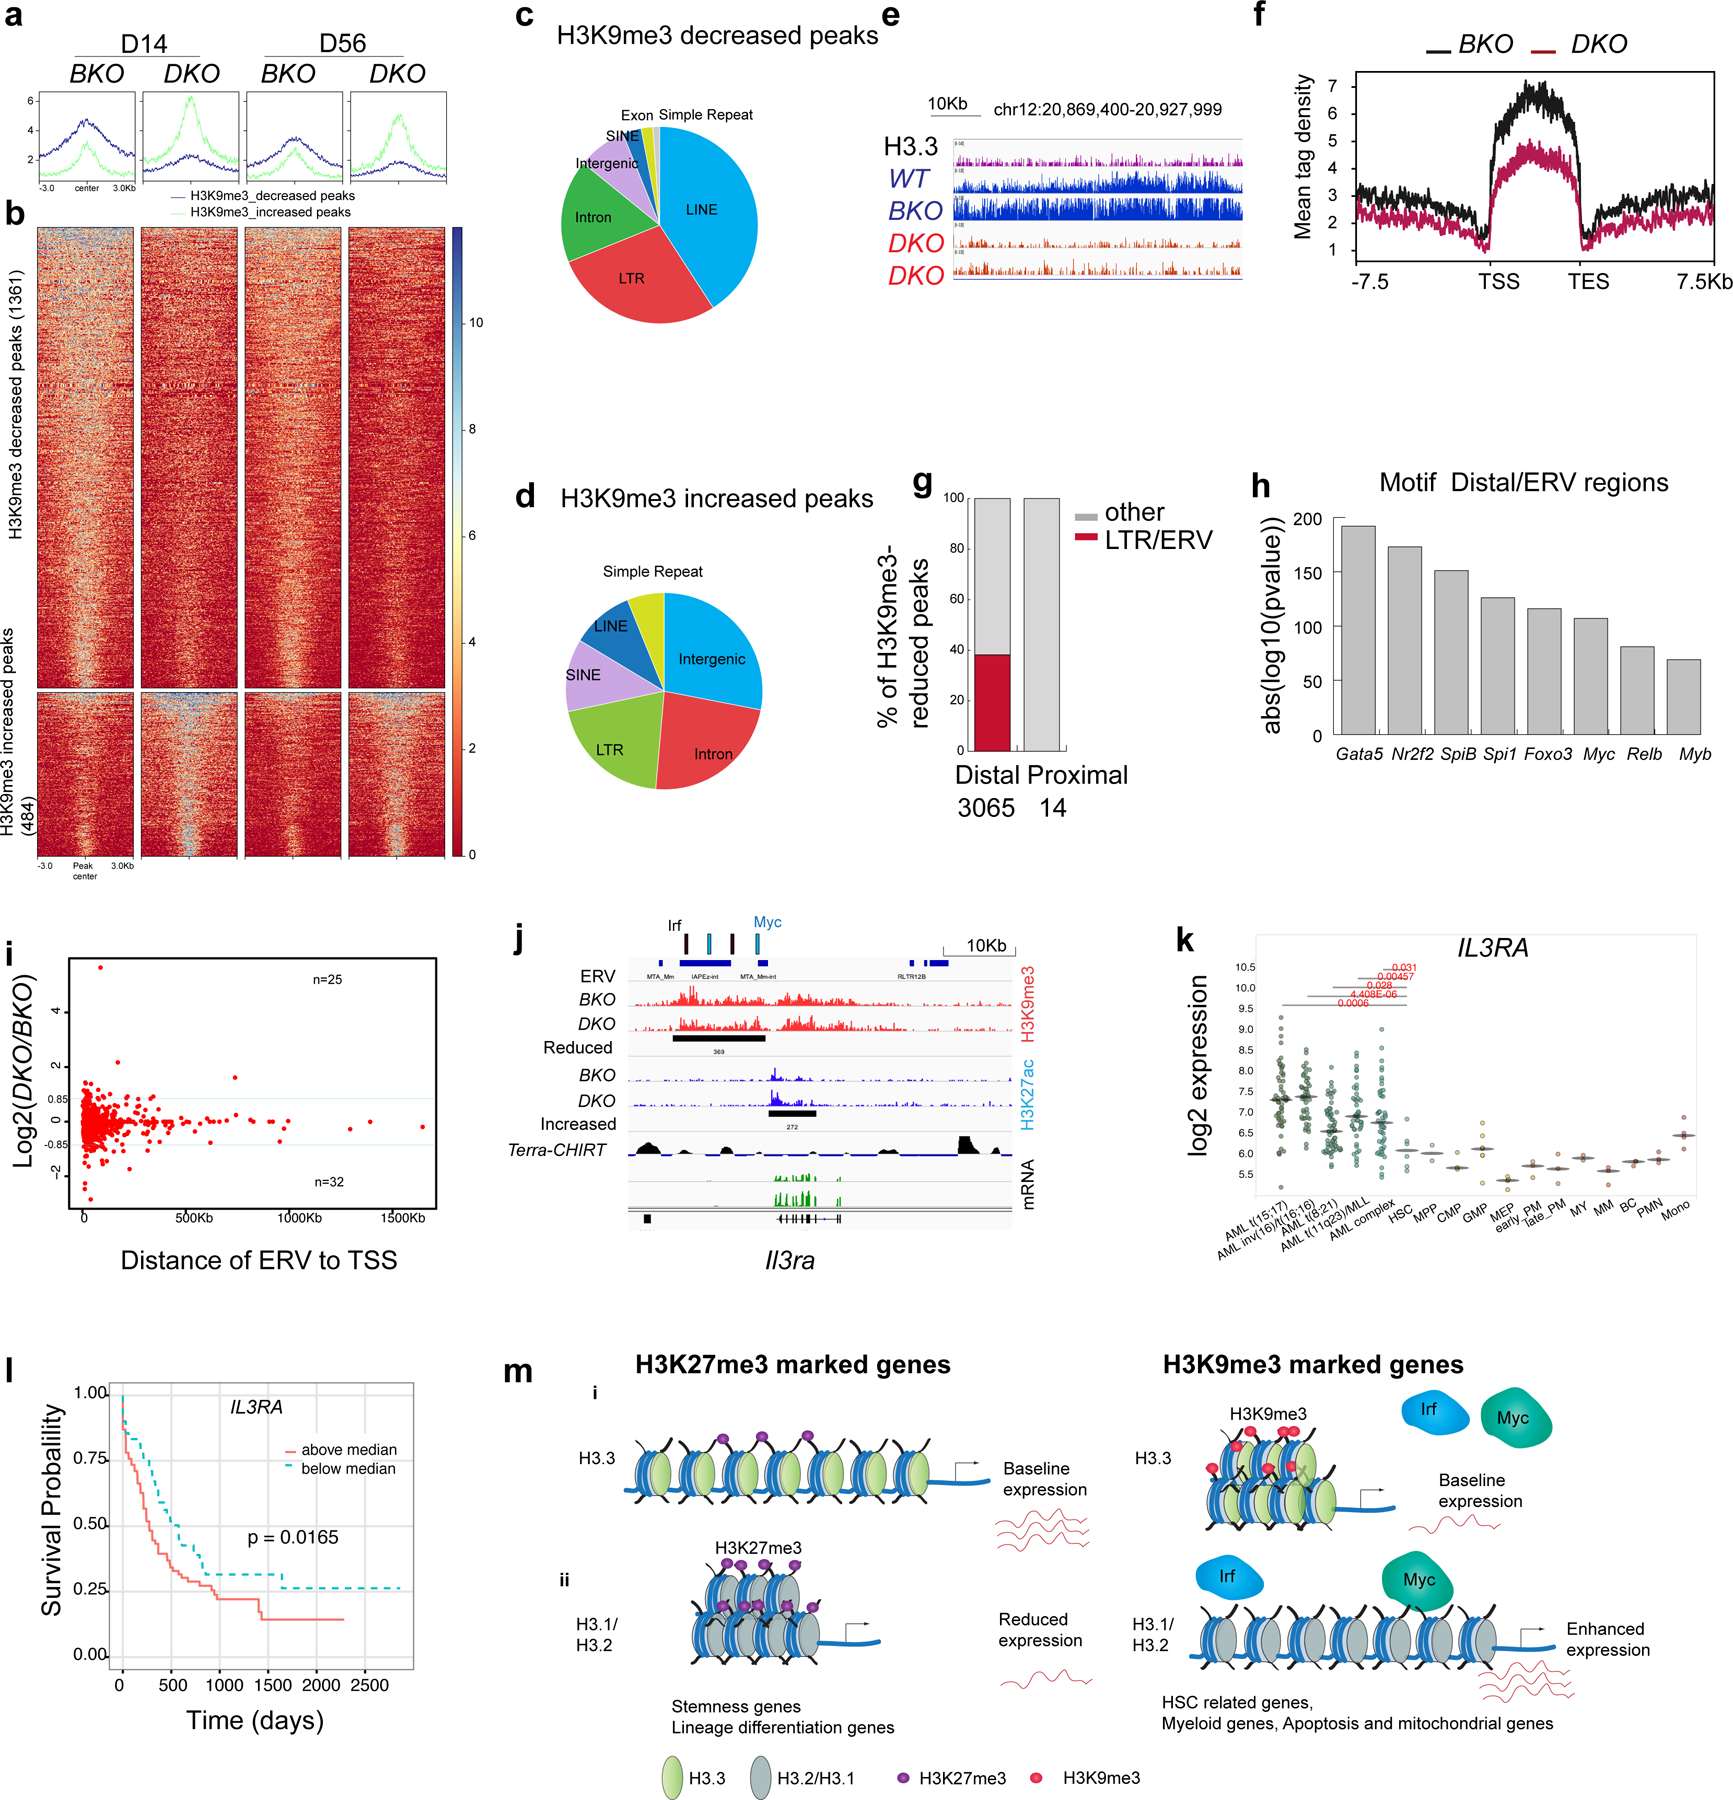
Fig. 6 |. ERVs in the H3K9me3-reduced regions as potential enhancers to regulate survival genes.

a,b, Histograms (a) and heatmaps (b) of the H3K9me3 densities for H3K9me3-decreased and -increased regions in BKO and DKO HSPCs (false-detection rate (FDR) < 0.01, FC > 1.6). c,d, Genome-wide distribution of H3K9me3-decreased (c) and -increased (d) peaks. e, Example of H3K9me3-reduced mountains. f, Histogram of the H3K9me3-reduced mountains in BKO and DKO HSPCs on day 14 after H3.3A deletion. TES, transcription end site. g, Percentage of ERVs at the distal and proximal loci within the H3K9me3-reduced regions. Distal peaks, distance to TSS of >1,000 bp. Proximal regions, distance to TSS of <1,000 bp. h, Motif analysis of ERV-overlapped distal H3K9me3-reduced regions. i, Fold change in mRNA levels in DKO LKS cells compared with BKO LKS cells plotted against the distance of the ERV to its TSS. Blue line, Log2(DKO/BKO) = 0.85 or −0.85. j, Integrative Genomics Viewer view of the promoter and enhancer regions for Il3ra showing the reduced H3K9me3 enrichment upstream of its TSS, the ERV elements and the putative binding sites for the transcription factors Irf4 and Myc near the H3K9me3-reduced region. Terra, telomeric repeat-containing RNA. Terra has been shown to serve as an epigenomic modulator in trans and regulate the telomerase function in cis1. The Terra binding site is shown here as a reference. CHIRT, chromatin isolation of RNA targets. k, Expression levels of IL3RA in AML, normal haematopoietic progenitor and normal differentiated lineage cells2. Each dot represents an independent biological sample. Mono, monocyte; MEP, megakaryocyte erythroid progenitor; MY, myeloid; BC, B cell. The P values were calculated using an unpaired two-tailed Student’s t-test; *P < 0.05, **P < 0.01 and ***P < 0.001. l, Kaplan–Meier survival curve of patients with AML stratified into two groups—that is, individuals with IL3RA expression levels above or below the median51. m, Working model. (i) H3.3 maintains adult HSC homeostasis and prevents premature myeloid differentiation by regulating H3K27me3 and H3K9me3 enrichment. After H3.3A deletion, the reduction in H3K9me3 promotes transcription-factor binding and enhanced mRNA expression of target genes, conferring adapted survival for H3.3-null cells (right). (ii) For stemness genes and lineage-differentiation genes (RBCs), H3.3 prevents H3K27me3 enrichment at their promoter regions. H3.3 represses gene expression via H3K9me3 enrichment. After H3.3 deletion, the deposition of canonical histones H3.1 and H3.2 is unaffected (right). H3.2 and H3.1 are most probably deposited into the H3.3-null nucleosomes. Numerical source data are provided.
