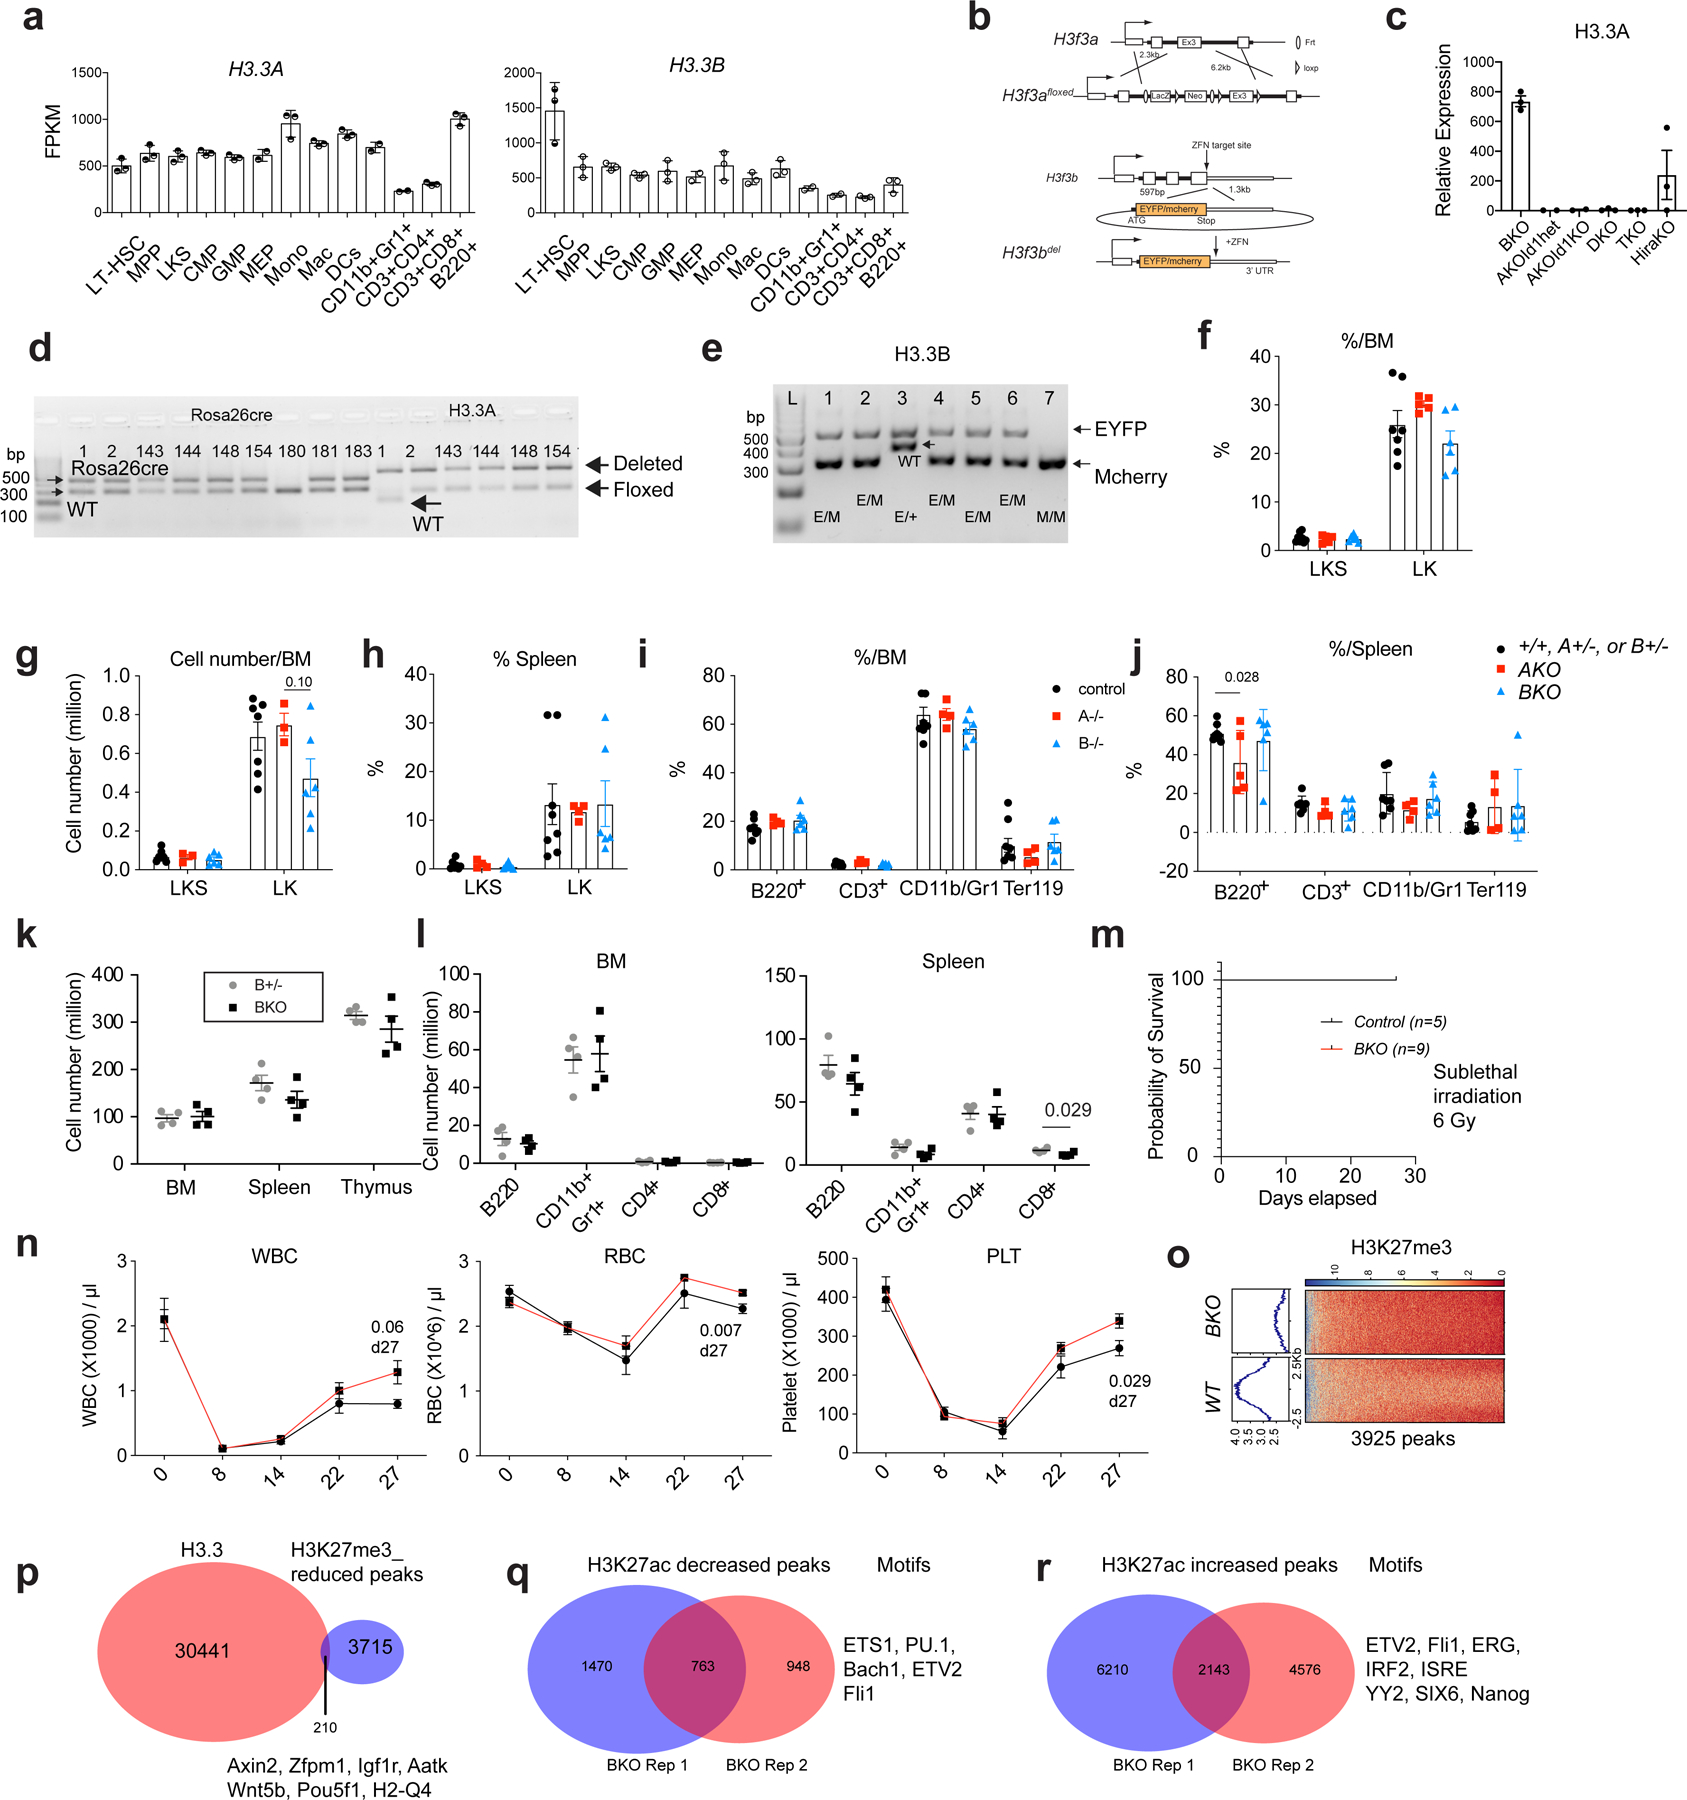
Extended Data Fig. 1 |. H3.3A and H3.3B are redundant during steady state hematopoiesis.

a. the Fragments Per Kilobase of transcript per Million mapped reads (FPKM) of H3.3A and H3.3B in hematopoietic cells. LT-HSC, long-term hematopoietic stem cells; MPP, multipotent progenitor cells; CMP, common myeloid progenitor cells; GMP, granulocyte macrophage progenitor cells; MEPs, megakaryocyte erythroid progenitor cells. Mono, Monocytes; Mac, macrophages; DCs, dendritic cells; CD11b+Gr1+ cells, granulocytes. The number of dots indicated the number of biological replicates. b. The design of the H3.3Afl/fl allele and the H3.3BEYFP/mcherry knockin knockout allele. c. qRT-PCR quantification of H3.3A mRNA expression within LKS cells after tamoxifen treatment. TKO is Id1mut/mut; DKO mice. d-e, genotyping of Rosa26creERT2, H3.3A floxed, WT, and deletion allele; H3.3B-EYFP or H3,3-mcherry allele (n>3 biological replicates were used). f-g. Percentages and numbers of c-Kit+Sca1+Lin− (LKS) or c-Kit+Sca1−Lin− LK cells within control (+/+, H3.3A+/−, or H3.3B+/−), H3.3AiKO/iKO (AKO), and H3.3B−/− (BKO) mice. h. Percentages of LKS and LK cells among LinN cells of control, AKO, and BKO mice. i. percentages of lineage cells within BM or spleen of control, AKO, and BKO mice. j. The total number of cells within BM, spleen, and thymus of H3.3B+/− (Bhet) or BKO mice. k-l, The total number of lineage cells with BM and spleen or Bhet or BKO mice. m-n, Recovery after myelosuppression with sublethal total body irradiation at 600 cGy. m, Survival probability after total body irradiation. n. white blood cells (WBC), red blood cells (RBC) and platelets (PLT) in the PB of control or BKO mice. o. Trimethylation at histone 3 lysine 27 (H3K27me3) profiling at WT or BKO LKS cells. Genome-wide, there were 3925 regions with reduced H3K27me3 enrichment. p. 210 of the H3K27me3 reduced regions in BKO LKS cells colocalize with H3.3 enrichment. q-r. We also profiled the enhancer mark, H3K27ac in BKO or WT cells, and identified the regions with increased or decreased H3K27ac enrichment. Motifs within those regions are also shown. For panels a, c, f-l, the number of dots indicate the number of animals. For m, n, n=5 mice for control group and n=9 for BKO group. Error bars indicate standard error of mean. p-value is calculated using unpaired, 2-tailed t-test. For h, p-value for the data points at day 27 was calculated using unpaired, 2-tailed t-test. Numerical source data are provided in Source Data.
