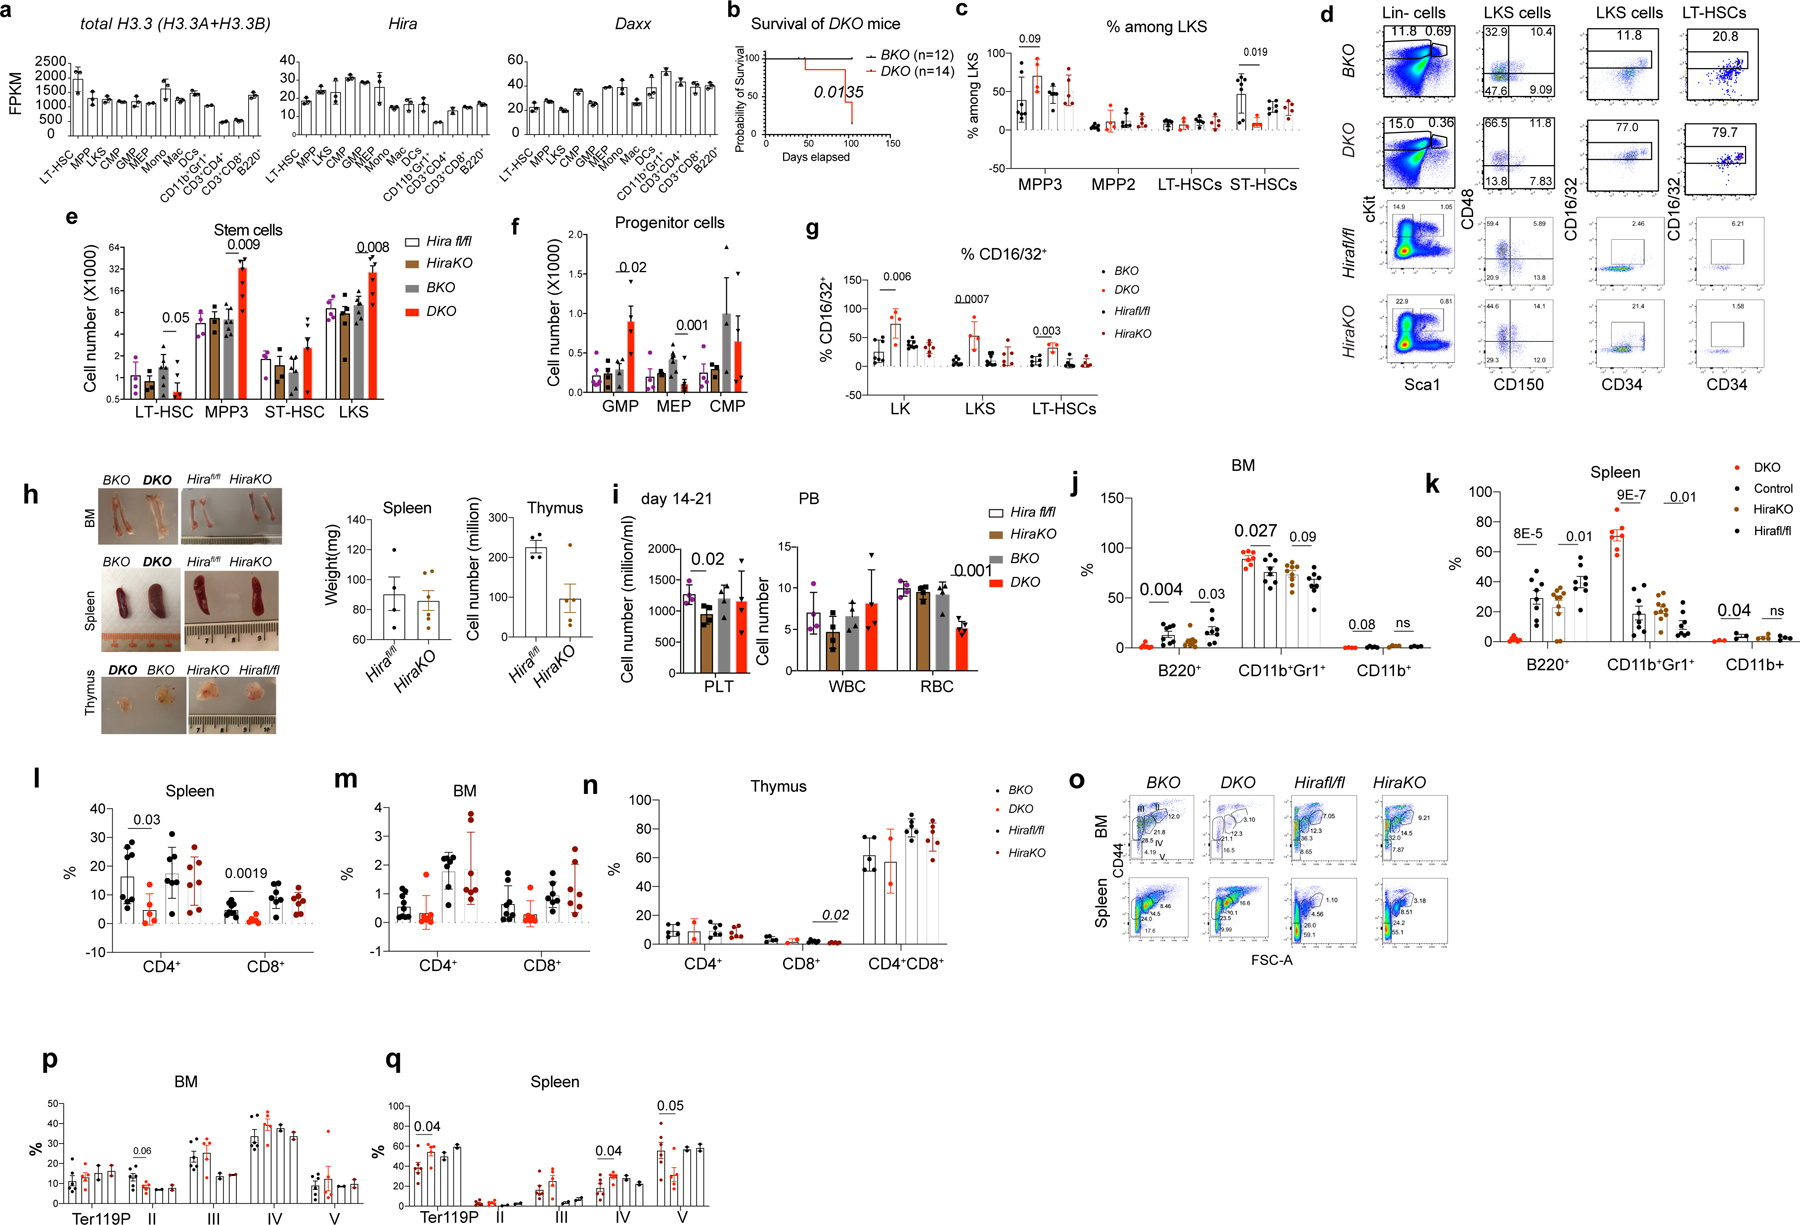
Extended Data Fig. 2 |. Adult inducible deletion of H3.3A, but not its chaperone Hira resulted in myeloid bias.

a. FPKM of total H3.3, calculated as the sum of H3.3A and H3.3B, Hira, and Daxx in hematopoietic cells. b. Survival probability of DKO or BKO mice following tamoxifen treatment. c. Representative flow cytometric plots for the gating of LKS cells, LT-HSCs (CD150+CD48− LKS), MPP3 (CD150−CD48+ LKS), MPP2 (CD150+CD48+ LKS), and ST-HSCs (CD150−CD48− LKS) for BKO, DKO, Hirafl/fl or HiraKO mice. d-e. The percentages and the total number of LT-HSCs, MPP3, ST-HSCs, and LKS cells. f. The total number of progenitor cells at 2–3 weeks after H3.3 or Hira deletion. GMP, CD16/32+CD34+LK; MEPs, CD16/32−CD34−LK-cells; CMP, CD16/32−CD34+LK. g. At week 2, 3, 4, or 7 after tamoxifen injection, the upregulation of GMP marker CD16/32 on LKS and LT-HSCs in DKO mice. h. BM, spleen, and thymus of BKO, DKO, Hirafl/fl or HiraKO mice. Note the BM anemia phenotype and enlarged spleen for DKO mice. On the right, the spleen weight and thymocytes numbers are shown for HiraKO mice. i. CBC for BKO, DKO, Hirafl/fl or HiraKO mice. j-k. the percentages of granulocytes or B cells in the spleen or BM. l-n, the percentages of CD4+, CD8+, and CD4+CD8+ cells within BM, spleen, and thymus of the indicated mice. o. Representative flow cytometric plots of the erythroid cell clusters II-V. p-q. the percentages and numbers of Ter119+, erythroid cells II, III, IV, and V within the BM and spleen of BKO, DKO, Hirafl/fl, and HiraKO mice. For panels 2a, c, e-n, p-q, the number of dots indicates the number of animals Error bars indicate standard error of mean (SEM). P-values are calculated using unpaired, two-tailed, t-test. ‘ns’, non-significant. Numerical source data and unprocessed gels are provided in Source Data.
