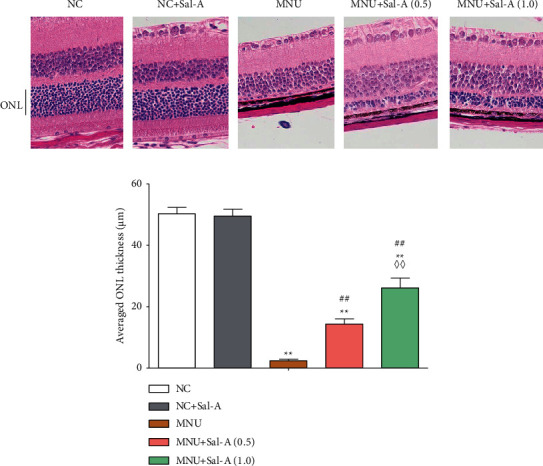
Figure 3.

Changes in retinal morphology of mice in each group on day 7 after MNU treatment. (a): Representative photograph of the central retina sectioned along the vertical axis (×400). (b): Histogram analysis of ONL thickness in each group (n = 10). ∗P < 0.05, ∗∗P < 0.01 vs. NC group; #P < 0.05, ##P < 0.01 vs. MNU group; ◇P < 0.05, ◇◇P < 0.01 MNU + Sal A (1.0) vs. MNU + Sal A (0.5).
