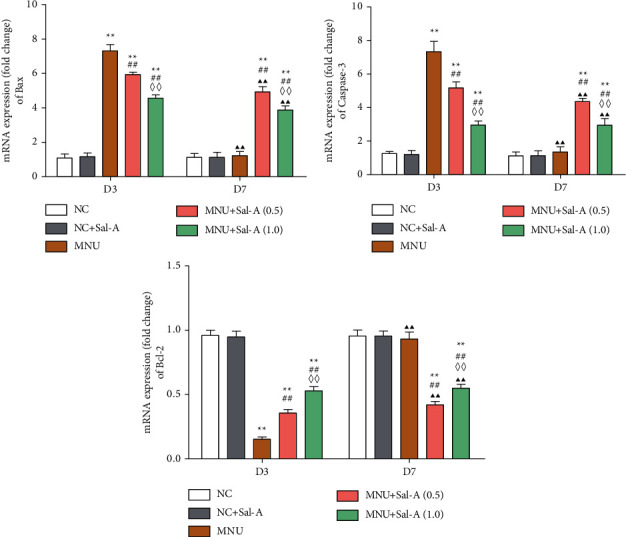
Figure 6.

Changes of mRNA in the levels of expression of Bax, caspase 3, and Bcl-2 in the retinas of mice in each group. The levels of expression of the mRNA of the three indicators on day 3 (D3) and day 7 (D7) of the treatment regimen as determined by RT-PCR. Data were normalized to the expression of the mRNA coding for β actin (n = 10). ∗P < 0.05, ∗∗P < 0.01 vs. NC group; #P < 0.05, ##P < 0.01 vs. MNU group; ◇P < 0.05, ◇◇P < 0.01 MNU + Sal A (1.0) vs. MNU + Sal A (0.5). ▲P < 0.05, ▲▲P < 0.01 vs. the value at day 3 in the same group.
