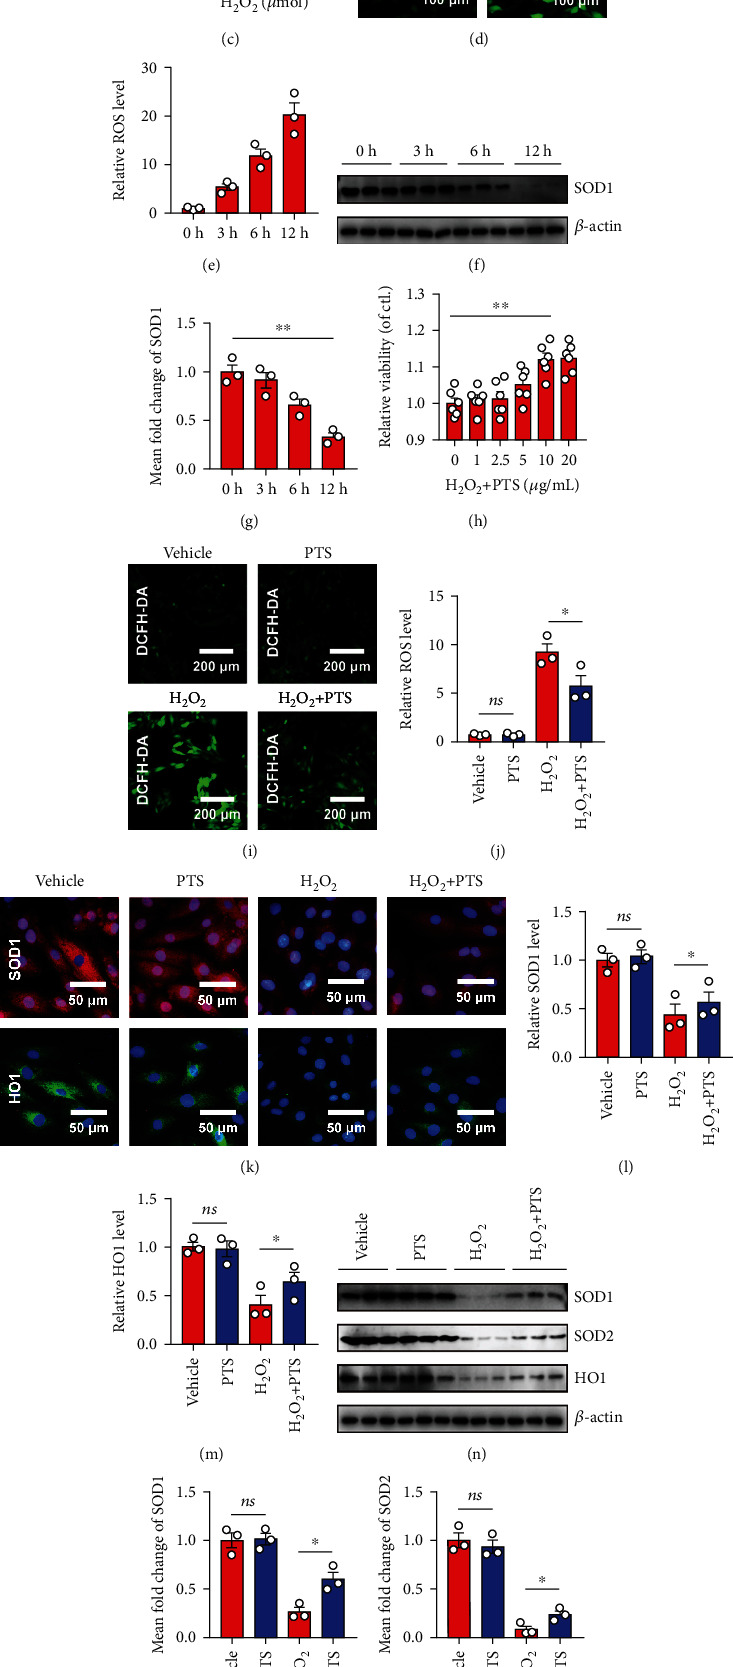
Figure 1.

Effects of PTS on H2O2-induced H9c2 cell redox homeostasis disorders. H9c2 cells were treated with different concentrations of H2O2 (0, 50, 100, 200, 400, or 600 μM) for 3, 6, or 12 hours. (a–c) The viability of H9c2 cells was determined by the CCK-8 assay. Values were normalized relative to the control group (representing 100% cell viability). Data are expressed as the mean ± SEM (n = 6). ∗P < 0.05, ∗∗P < 0.01. (d) Representative DCFH-DA images of H9c2 cells treated with 200 μM H2O2 for 12 h. (e) Relative ROS levels were quantified using ImageJ software (NIH, Bethesda, MD, USA). (f) Representative Western blotting results of SOD1 in 200 μM H2O2-treated H9c2 cells. (g) Relative SOD1 expression levels at various time points were quantified using ImageJ. H9c2 cells were preincubated with different concentrations of PTS (0, 1, 2.5, 5, 10, and 20 μg/mL) for 12 h, followed by treatment with 200 μM H2O2 for 12 h. (h) The viability of H9c2 cells was determined by CCK-8 assay. Values were normalized relative to the control group (representing 100% cell viability). (i) Representative DCFH-DA images of H9c2 cells. (j) Relative ROS levels were quantified using ImageJ. (k) Immunofluorescence assay was performed to determine the changes in SOD1 and HO1 protein levels in H9c2 cells. (l, m) SOD1 and HO1 levels were quantified using ImageJ. (n) Western blotting analysis showed the changes in SOD1, SOD2, and HO1 protein levels in H9c2 cells. (o–q) SOD1, SOD2, and HO1 levels were quantified using ImageJ. Data are expressed as the mean ± SEM (n = 3). ∗P < 0.05, ∗∗P < 0.01. ns: not significant; DCFH-DA: 2′,7′-dichlorodihydrofluorescein diacetate; PTS: panaxatriol saponins; SOD: superoxide dismutase.
