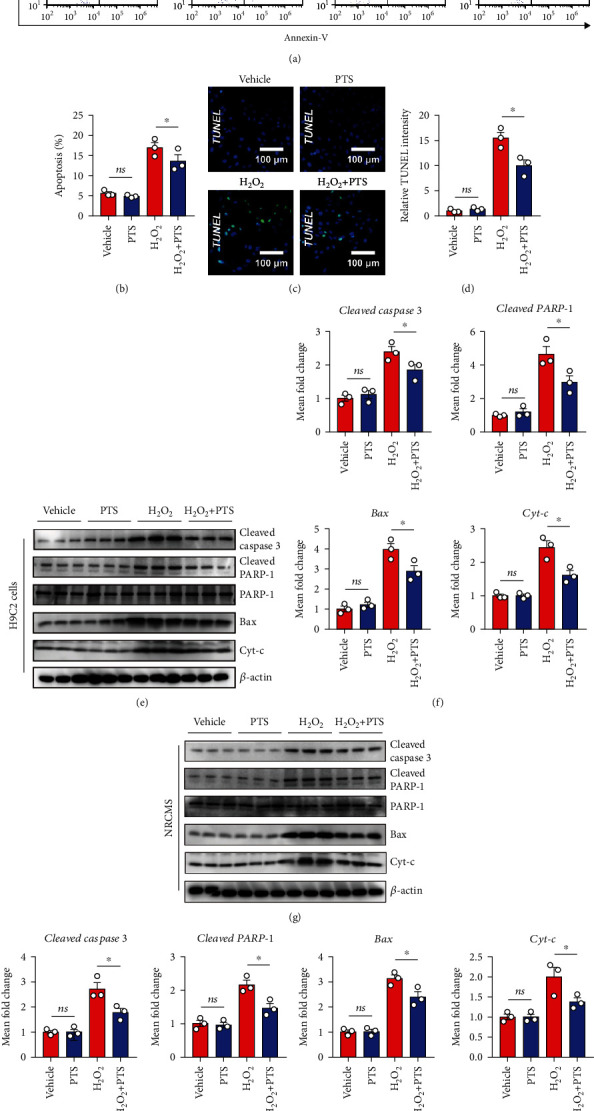
Figure 2.

Effects of PTS on the H2O2-induced apoptosis of H9c2 cells and NRCMs. H9c2 cells were preincubated with PTS (10 μg/mL) for 12 h followed by stimulation with 200 μM H2O2 for 12 h. (a) The apoptosis ratio was measured by flow cytometry. (b) The results were quantified using ImageJ software. (c) Representative TUNEL staining results of H9c2 cells. (d) Relative TUNEL intensities of each group were quantified using ImageJ. (e) Western blotting analysis showed the changes in apoptosis-related protein expression in H9c2 cells. (f) Relative expression levels of cleaved caspase-3, cleaved PRAR-1, Bax, and Cyt-c were quantified using ImageJ. NRCMs were preincubated with PTS (10 μg/mL) for 12 h followed by treatment with 200 μM H2O2 for 12 h. (g) Western blotting analysis showed the changes in expression of apoptosis-related proteins of NRCMs. (h) Relative expression levels of cleaved caspase-3, cleaved PRAR-1, Bax, and Cyt-c were quantified using ImageJ. Data are expressed as the mean ± SEM (n = 3). ∗P < 0.05, ∗∗P < 0.01. ns: not significant; NRCMs: neonatal rat cardiomyocytes.
