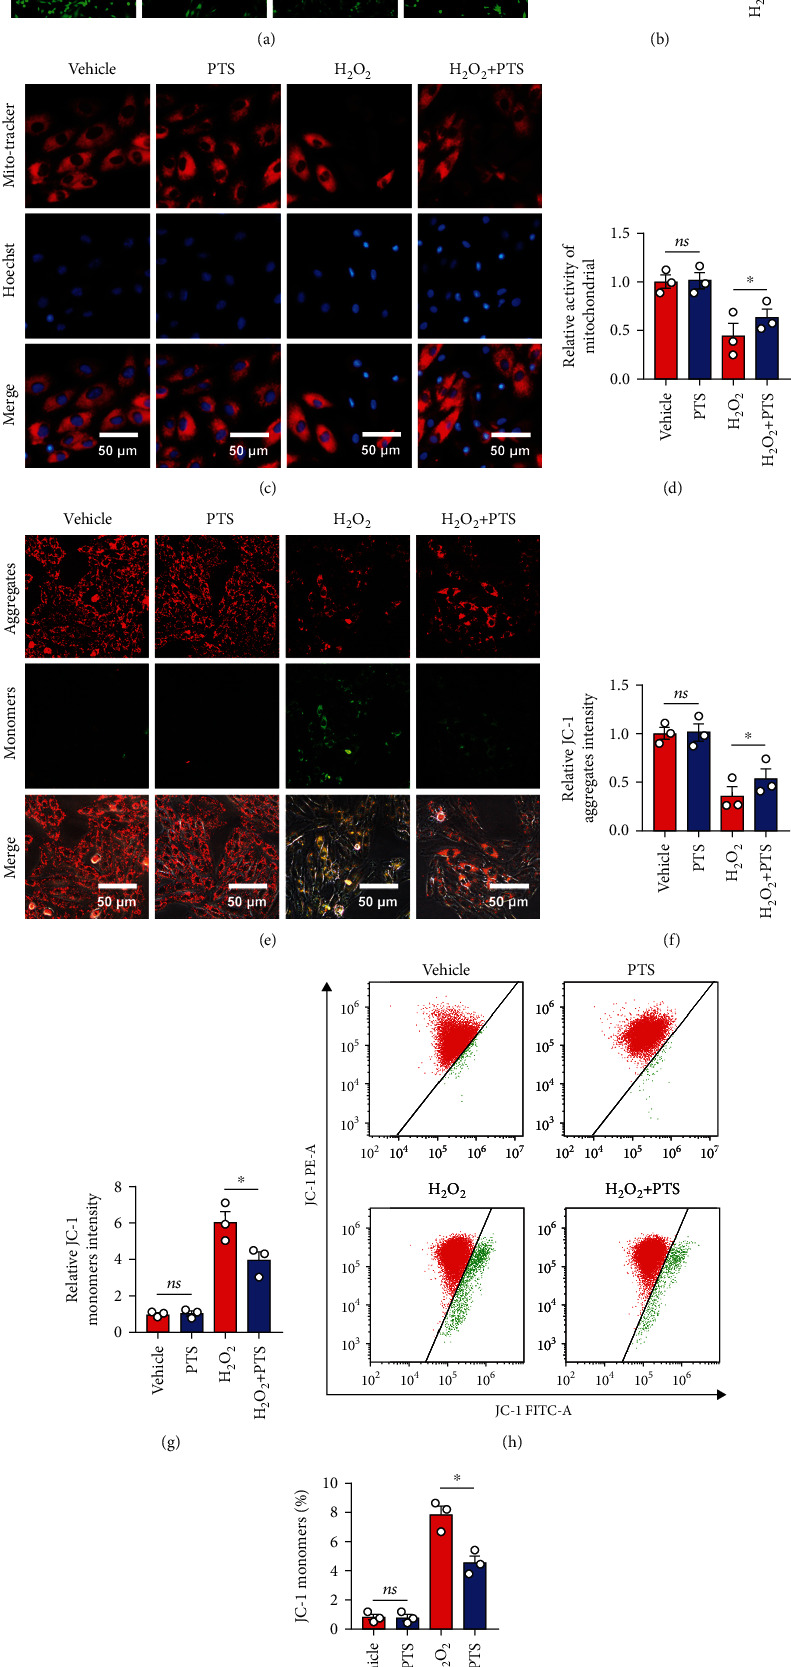
Figure 3.

Effects of PTS on mPTP opening and the mitochondrial membrane potential (ΔΨm) of H9c2 cells. H9c2 cells were preincubated with PTS (10 μg/mL) for 12 h followed by treatment with 200 μM H2O2 for 12 h. (a) The representative images of calcein AM staining. (b) Relative fluorescence intensity of calcein AM. (c) The status of mitochondria in H9c2 cells was determined by MitoTracker Red CMXRos. (d) Relative mPTP opening was quantified using ImageJ software. (e) Effects of PTS on the ΔΨm of H9c2 cells based on JC-1 staining. (f, g) Quantitative analysis of ΔΨm using ImageJ. (h) After JC-1 staining, PTS-treated H9c2 cell populations were analyzed by flow cytometry. (i) The percentage of JC monomer-positive cells was quantified using ImageJ. Data are expressed as the mean ± SEM (n = 3). ∗P < 0.05, ∗∗P < 0.01. ns: not significant; mPTP: mitochondrial permeability transition pore.
