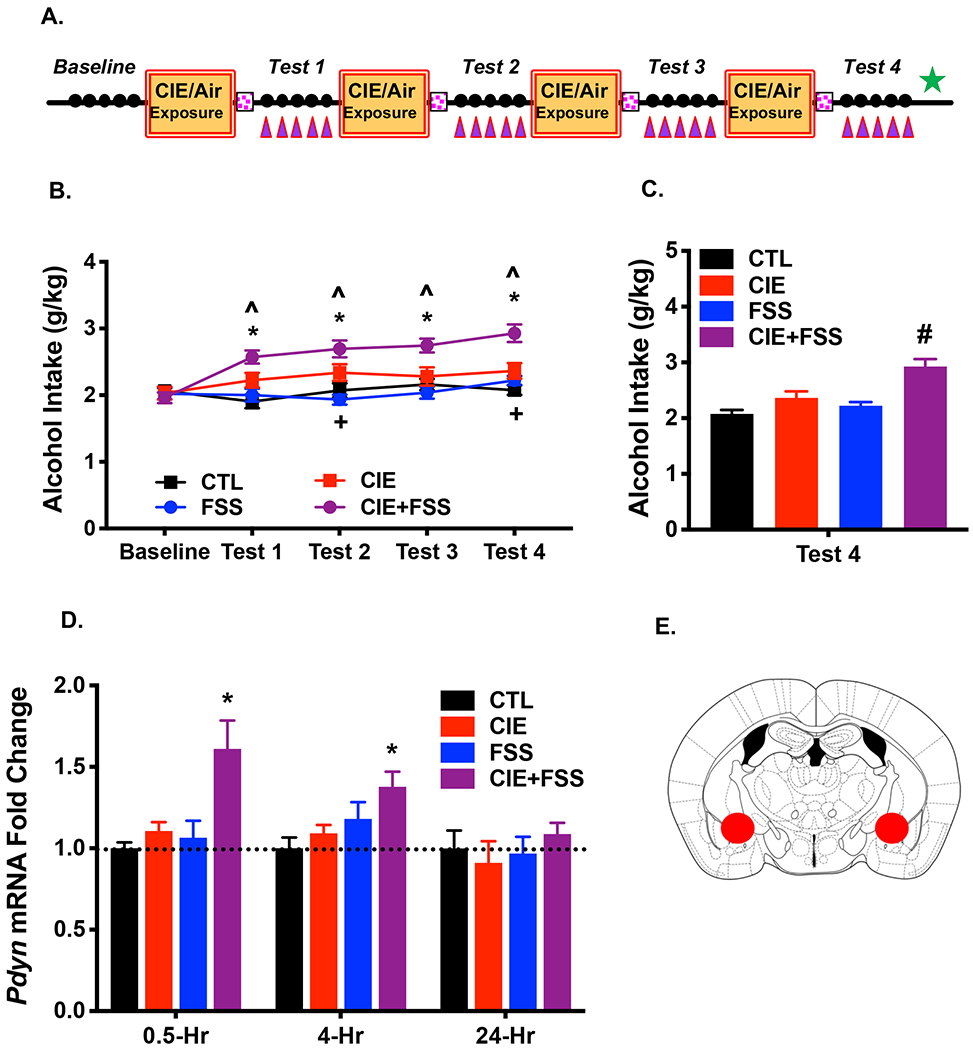
Figure 2: A History of CIE+FSS Exposure Increases Pdyn mRNA Expression in the CeA.

(A) Mice were sacrificed, and brain tissue was collected at 30-min, 4-hr, or 24-hr following the last FSS exposure during Test 4 (denoted by green star) to assess Pdyn mRNA expression in CeA (purple triangles denote FSS exposures) (N= 6-10/group/time point). (B) Average weekly alcohol consumption across each phase of the study. Alcohol intake increased compared to Baseline in the CIE-alone group during Test 2 and Test 4 (+ ps< 0.05); Alcohol drinking in the CIE+FSS group was significantly greater during each of the Test cycles compared to Baseline (* ps< 0.05) and compared to the CIE-alone group (^ ps< 0.05); Alcohol intake in FSS-alone and CTL groups during Test cycles did not differ from Baseline levels. (C) Average alcohol consumption during Test 4. Alcohol intake was greater in the CIE+FSS group compared to all other groups which did not significantly differ from each other (# ps< 0.001). (D) Pdyn mRNA expression in the CeA was significantly elevated in CIE+FSS compared to CTL mice at 30-min (* p< 0.01) and 4-hr (* p< 0.05) post-FSS exposure at the end of Test 4, returning to CTL levels at 24-hr. All values are mean ± s.e.m. (E) Schematic representation of tissue punches collected from the CeA.
