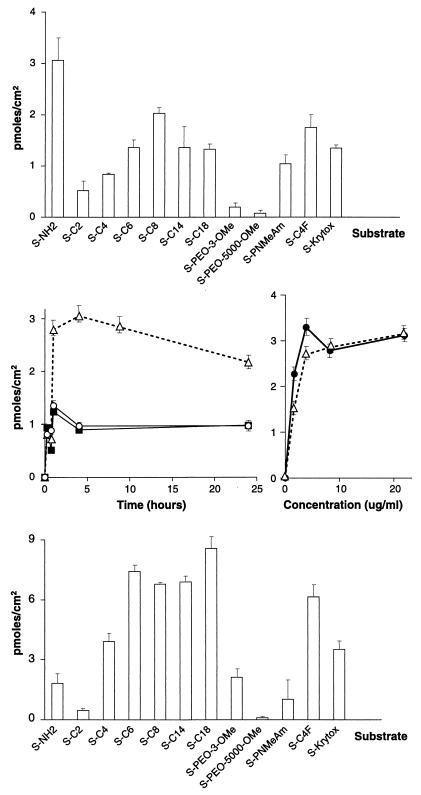
FIG. 2.
(Top) Adsorption of BSA to functionalized surfaces. (Middle) On the left, kinetics of adsorption of BSA are shown: S-NH2 (▵), S-C6 (○), and hydrophobized SiO2 (■). On the right, the adsorption of BSA against concentration is shown: S-NH2 (●) and S-C8F (○). (Bottom) Adsorption of cytochrome c to functionalized surfaces.

