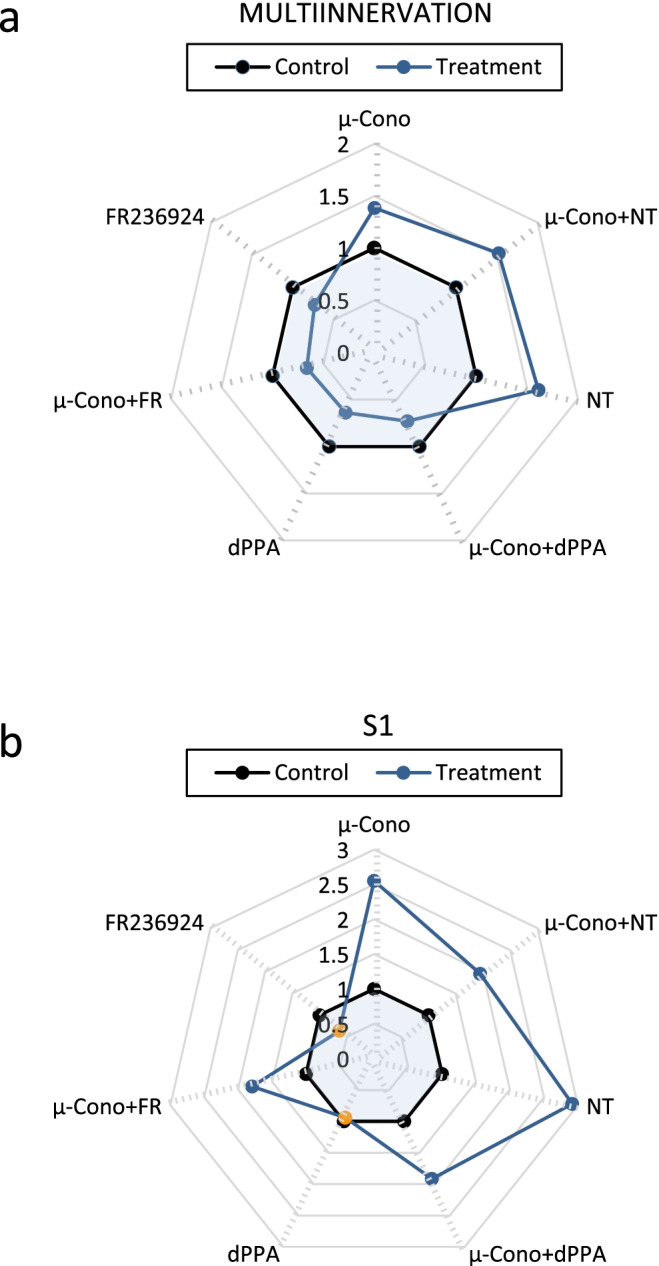
Fig. 4.

Diagrams are graphic representations that collectively show the pattern of action of the different agents and combinations of agents used. a Multi-innervation values. b Postsynaptic cluster (S1) values. The line between the blue and white areas means the ratio 1 (experimental value/control value) or “no effect.” Orange filled circles mean that the experimental value is not significantly different from the control value (p < 0.05). and filled circles that there is a significant difference (p > 0.05). SEMs are eliminated for clarity
